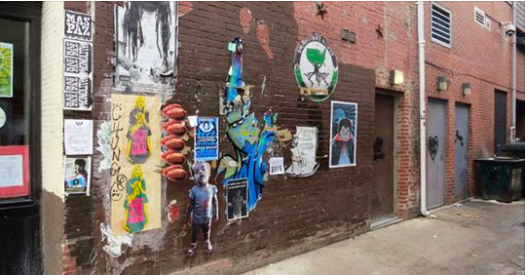
Ever wondered if you are living in one of the worst cities in the United States? Looking to relocate but not sure about the area? We have solved your problems with a comprehensive list of the worst cities in the country to live in. They rank in order ending with the worst city in the USA to live in. Take a look and see if you dodged the list!
50. Columbus, Georgia.
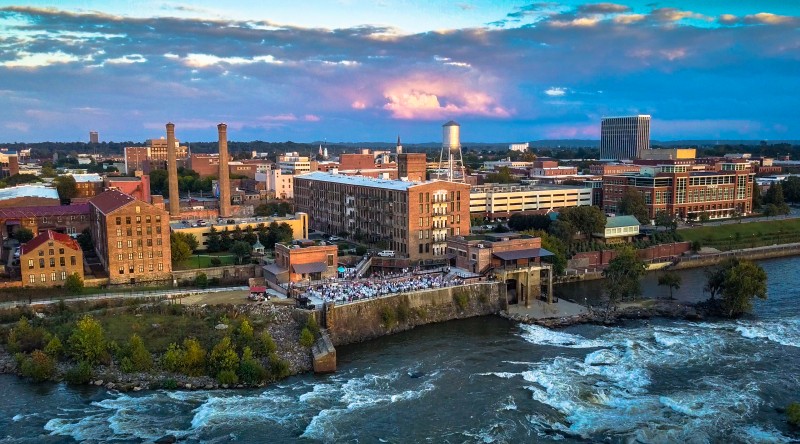
Population: 200,579, Average House Value: $137,000, Poverty Rate: 21.8%.
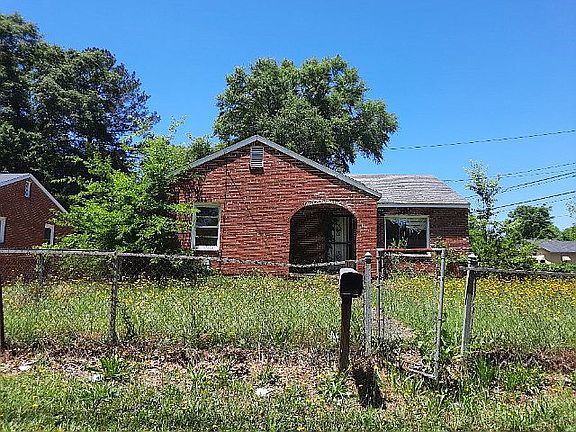
Percentage with at least a bachelors degree: 24.5%.

49. Kansas City, Kansas.
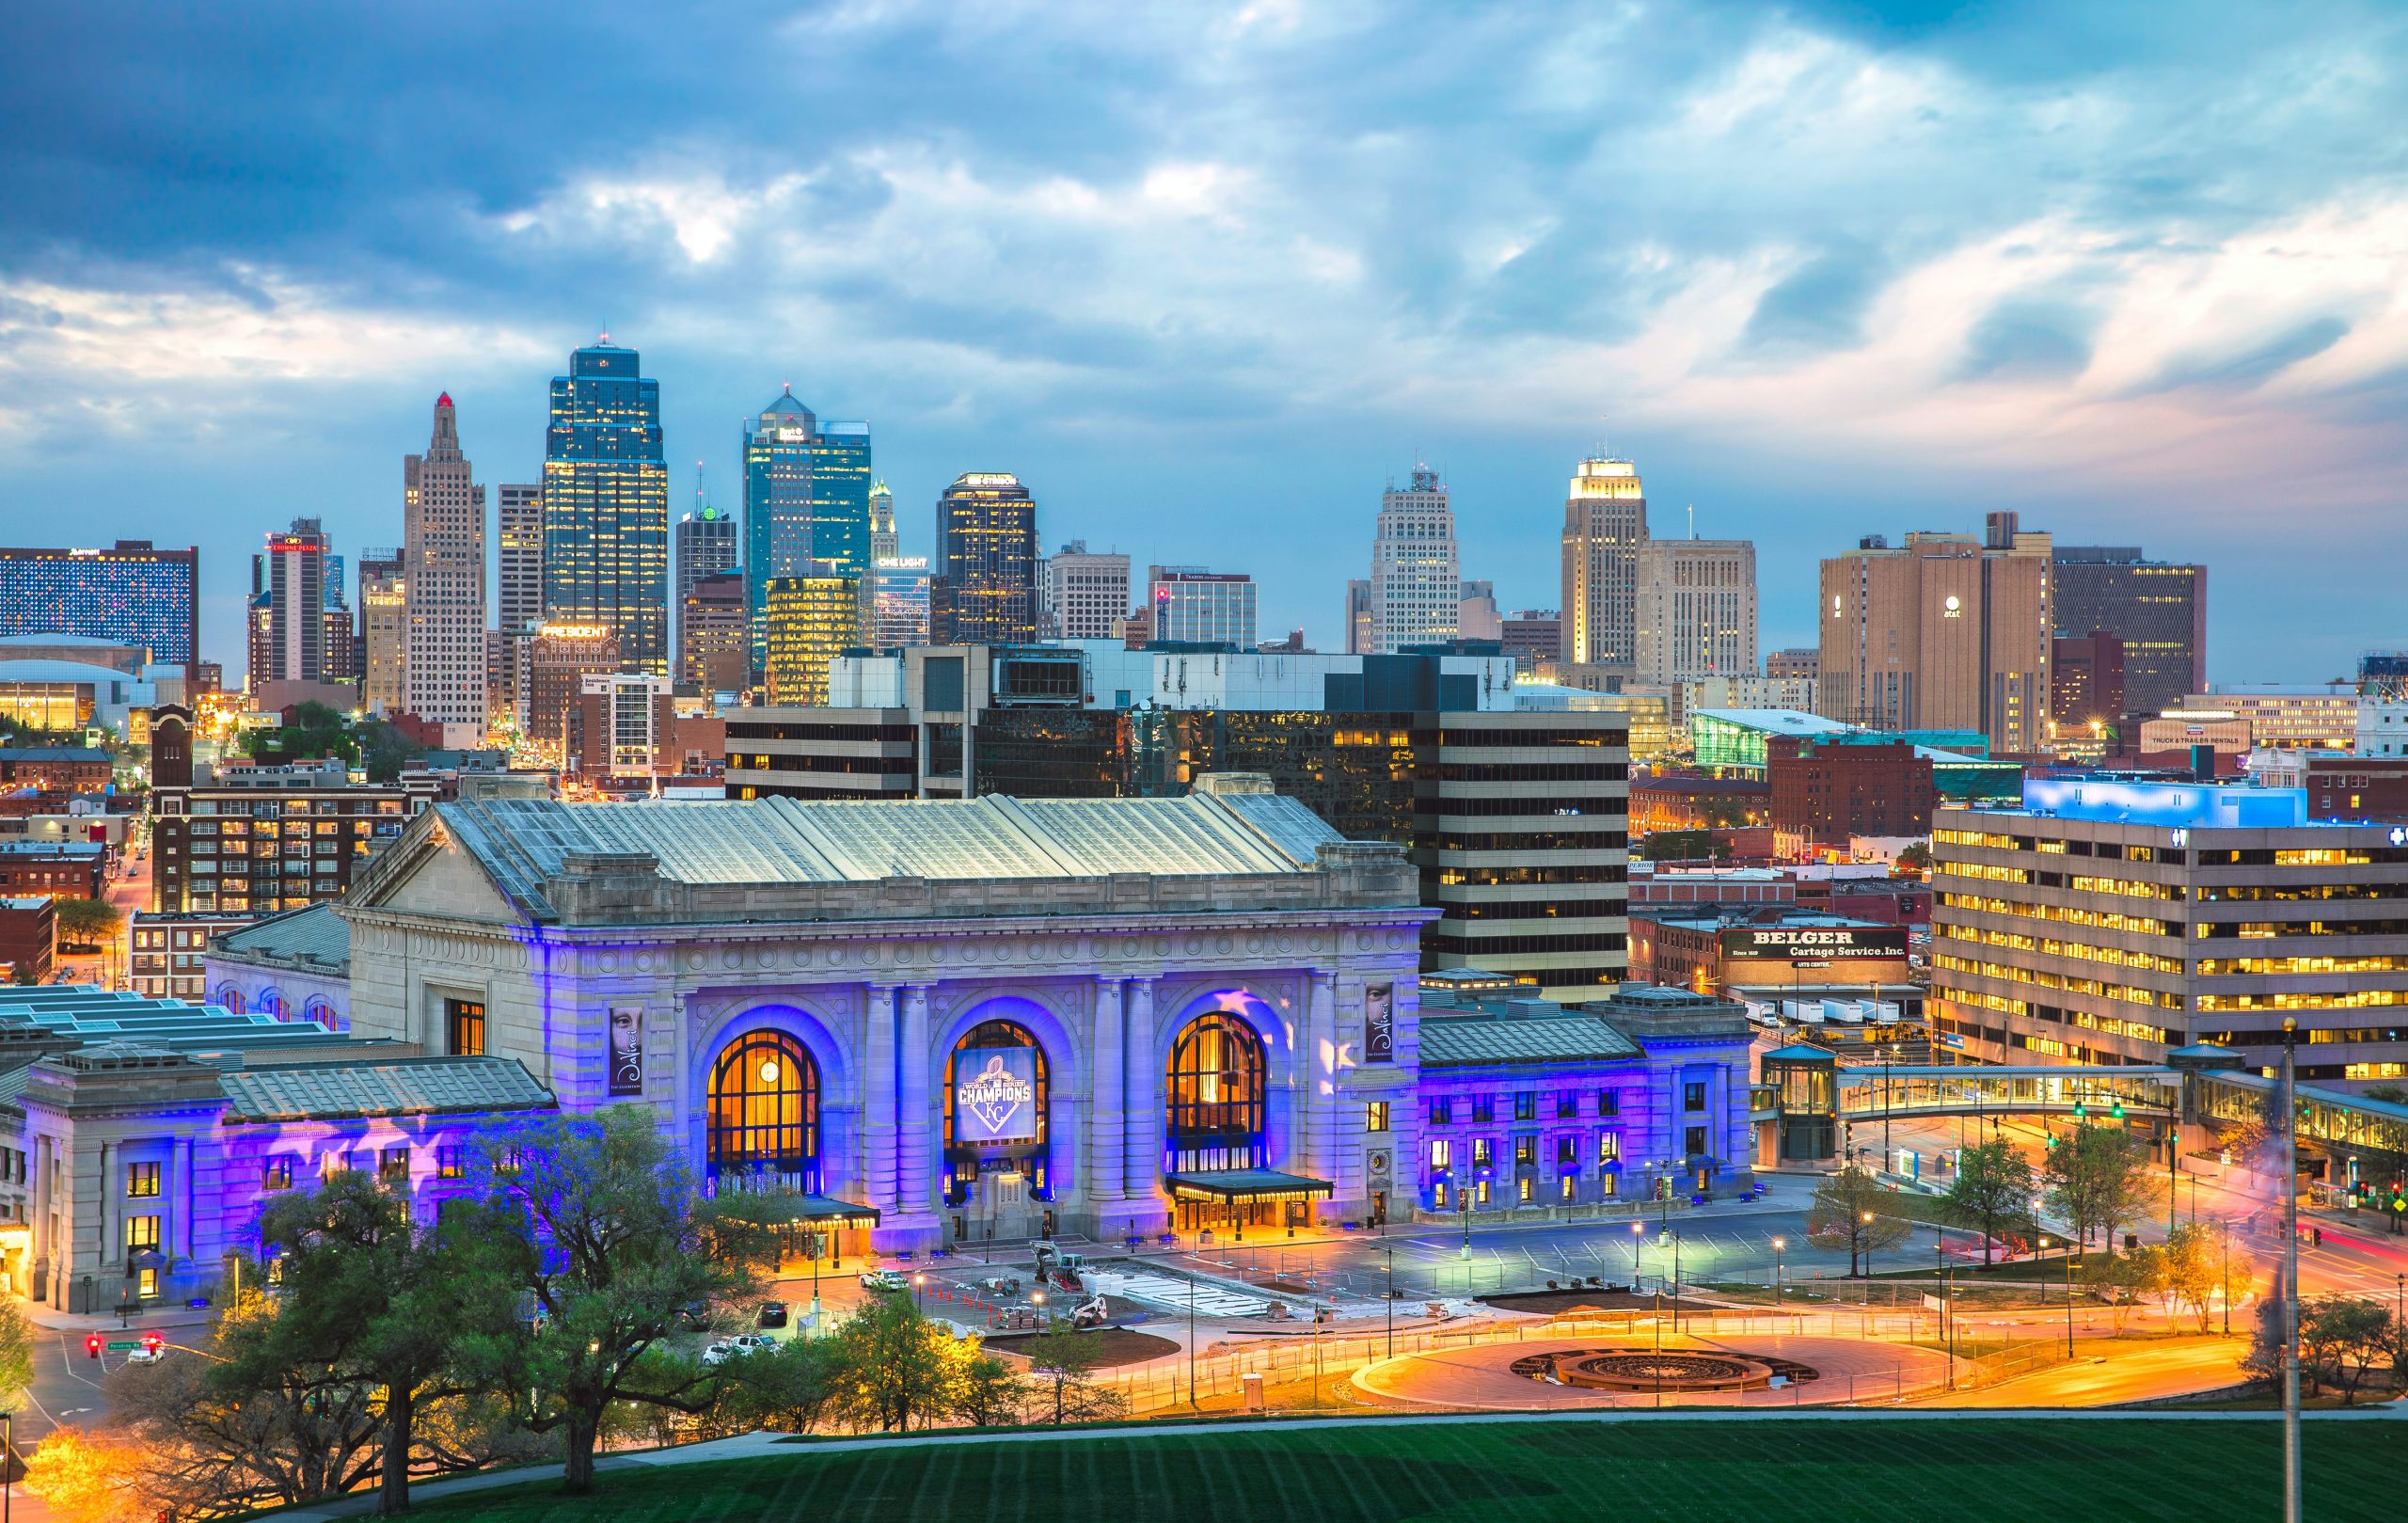
Population: 151,261 , Average House Value: $87,600, Poverty Rate: 22.2%.

Percentage with at least a bachelors degree: 16.3%.

48. Camden, New Jersey.

Population: 76,131, Average House Value: $84,200, Poverty Rate: 40.5%.
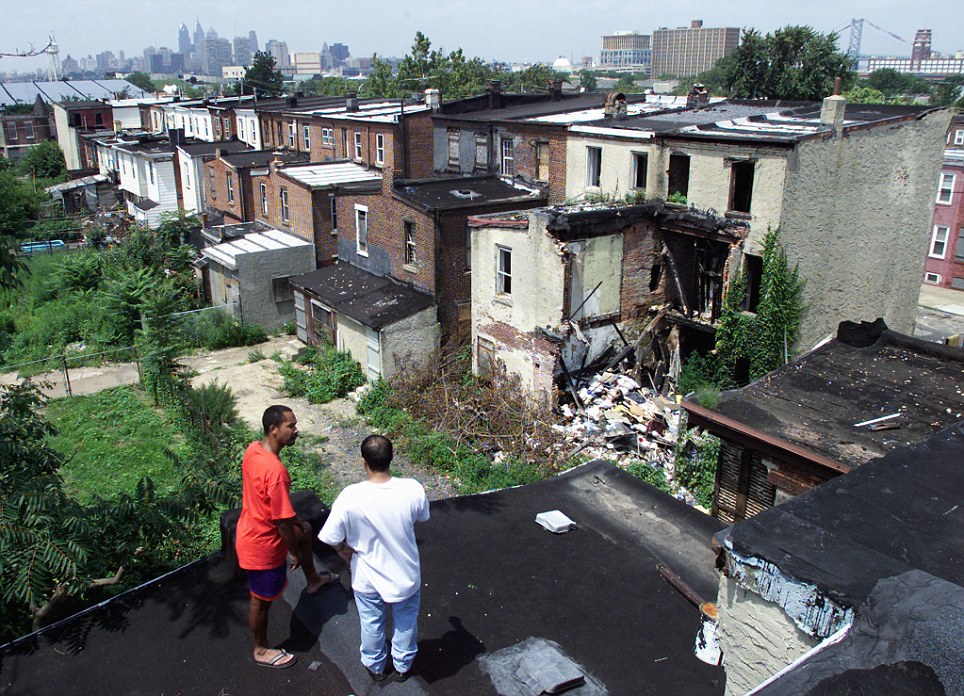
Percentage with at least a bachelors degree: 9.5%.

47. South Bend Indiana.

Population: 103,757, Average House Value: $79,500, Poverty Rate: 25.9%.
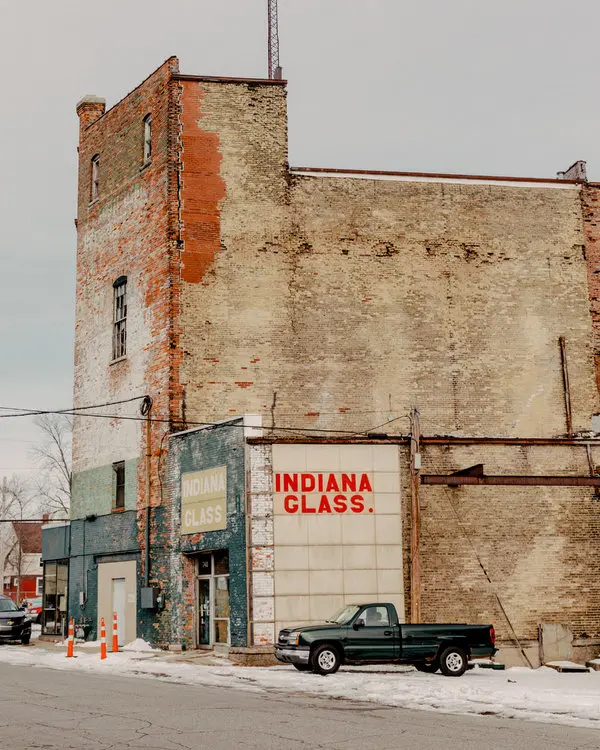
Percentage with at least a bachelors degree: 22.8%.

46. Shreveport, Louisiana.
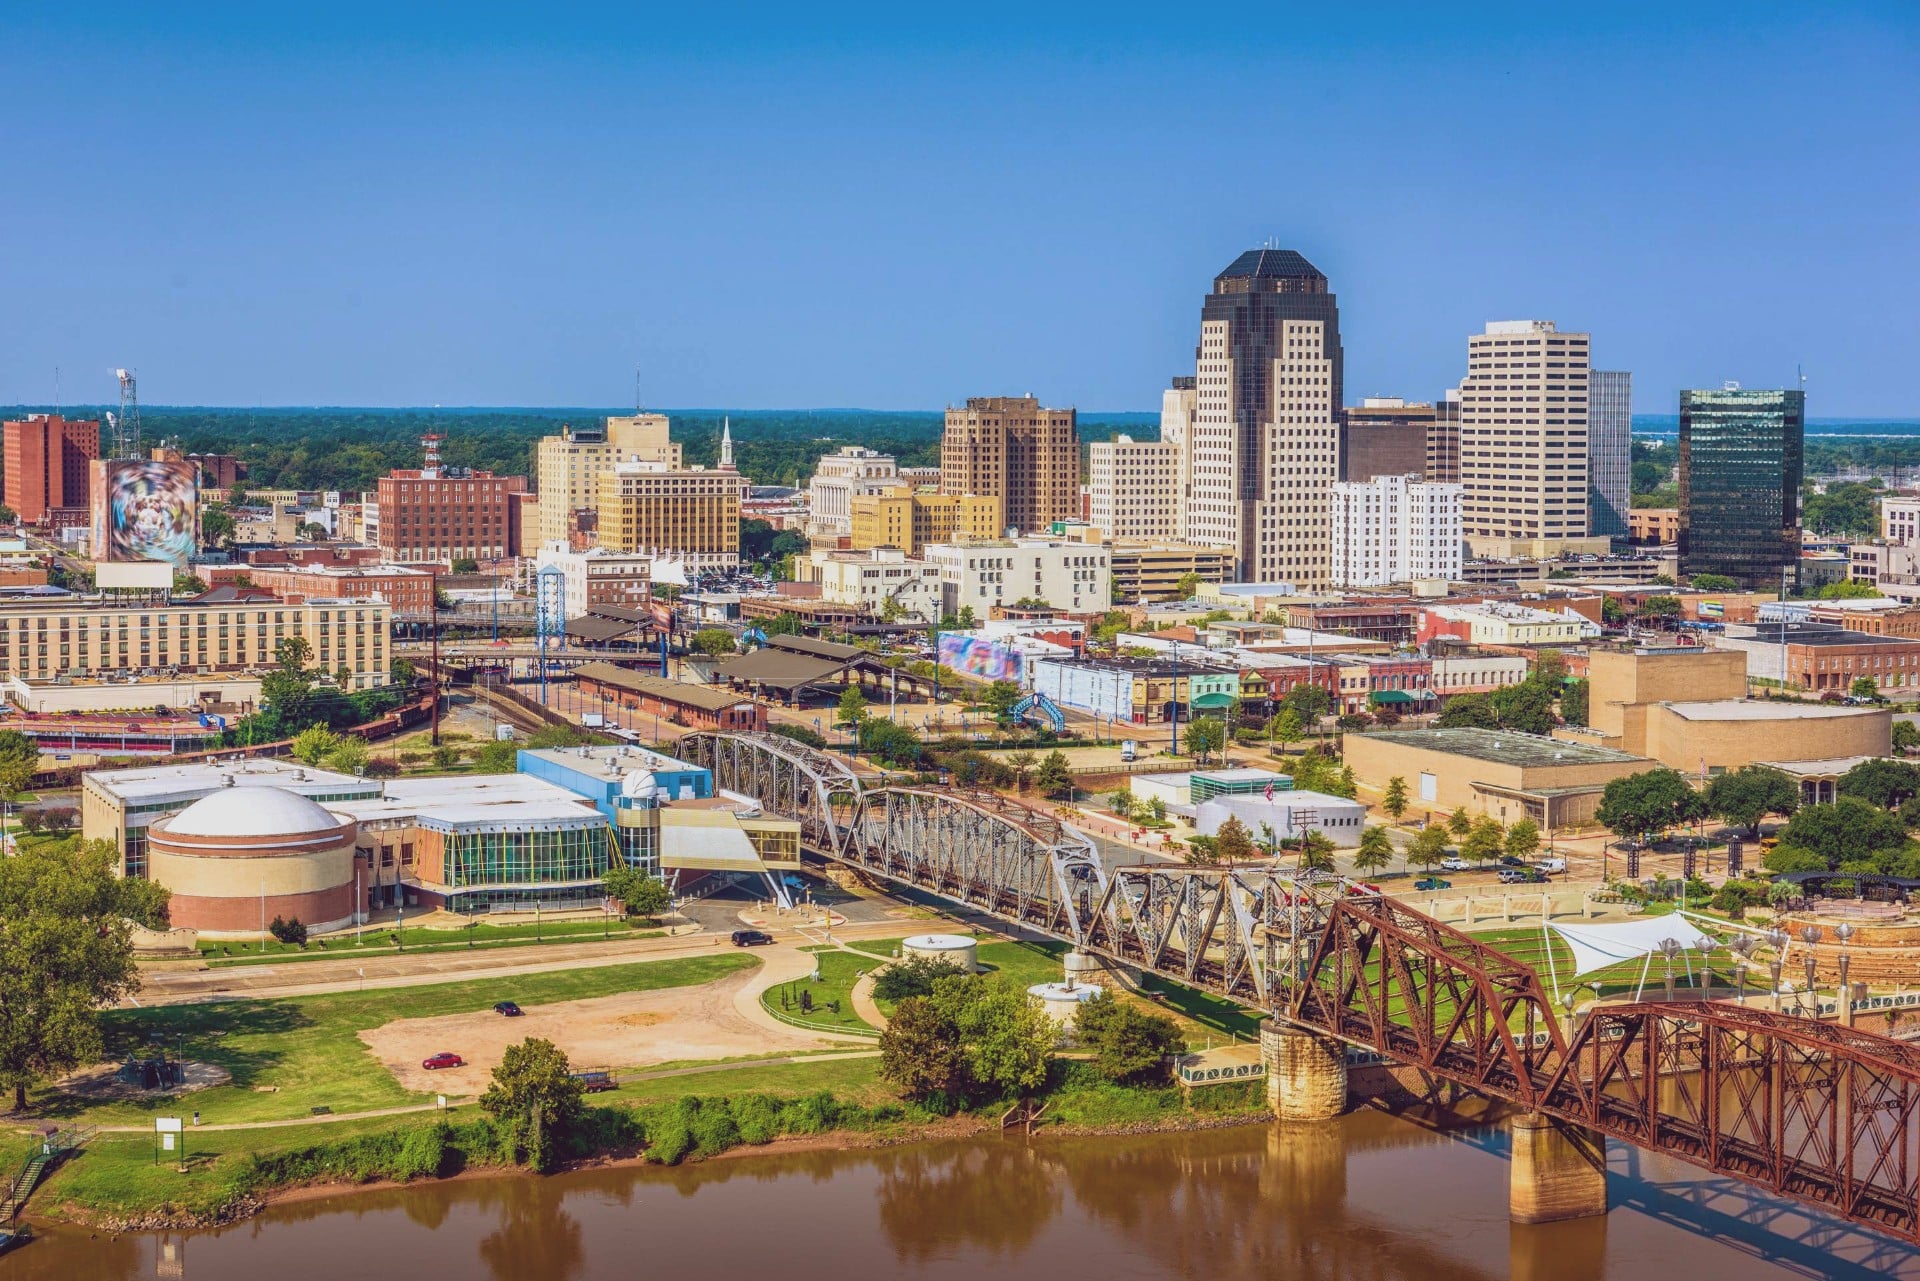
Population: 196,994, Average House Value: $141,000, Poverty Rate: 23.4%.
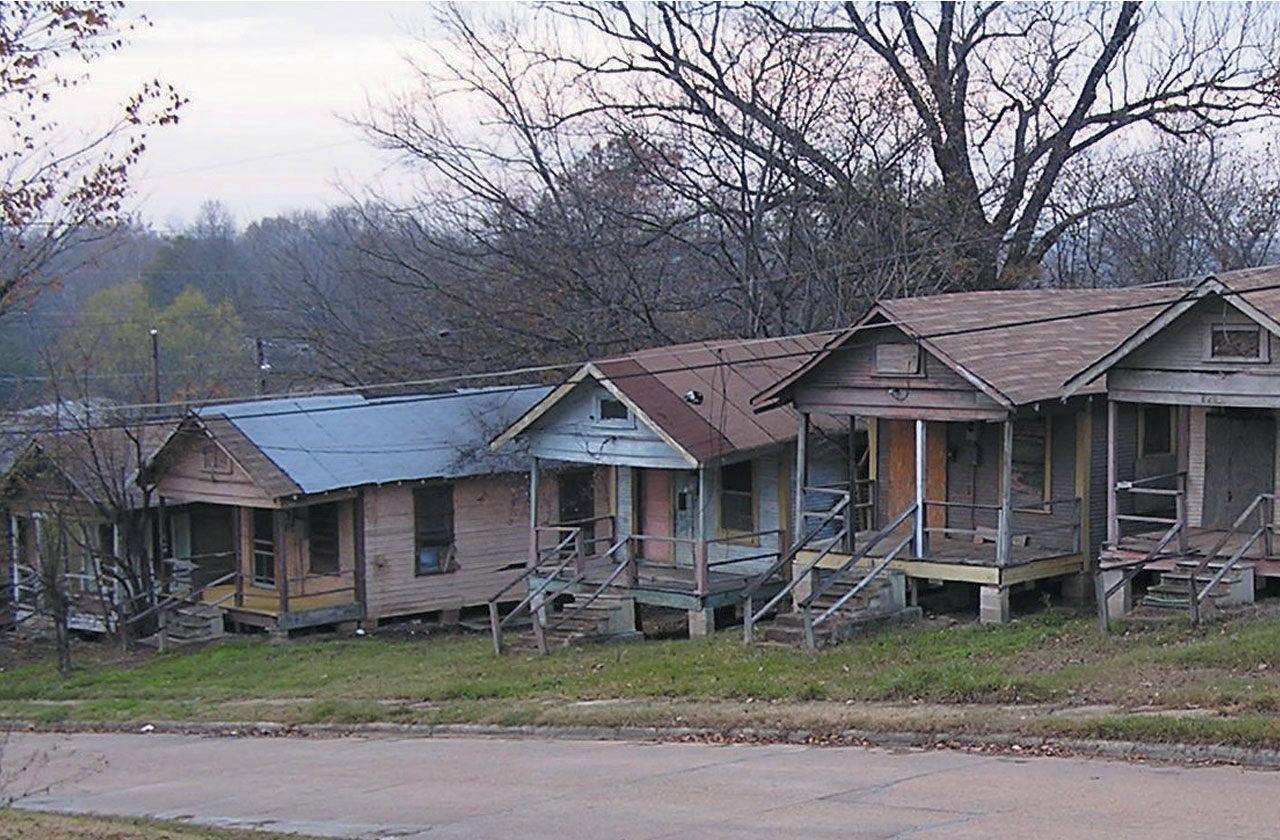
Percentage with at least a bachelors degree: 24.9%.

45. Gastonia, South Carolina.
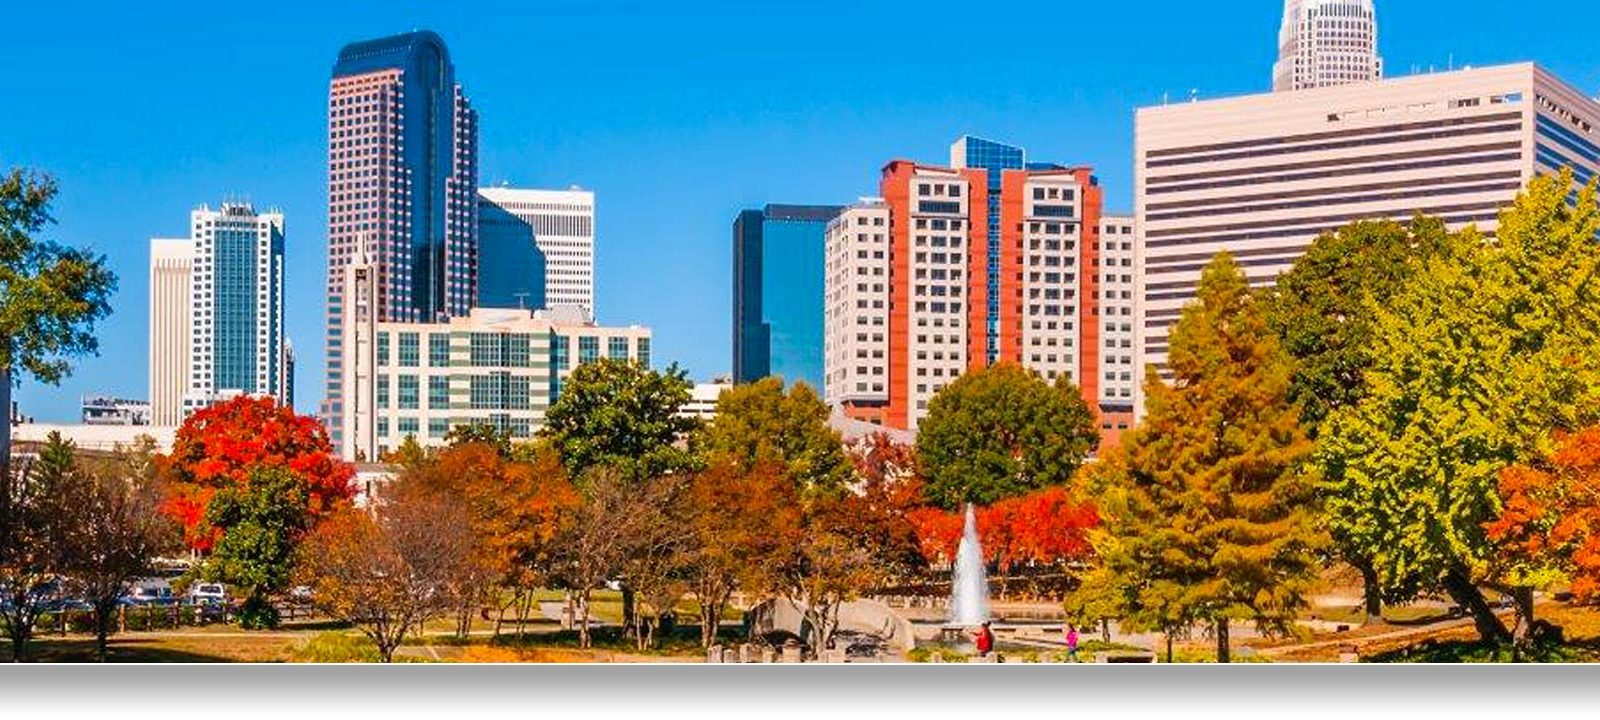
Population: 74,551, Average House Value: $134,300, Poverty Rate: 19.7%.
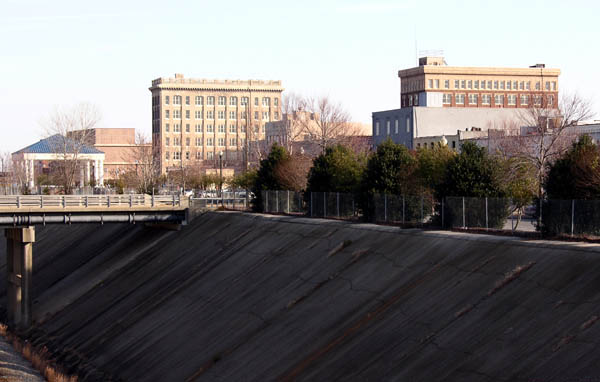
Percentage with at least a bachelors degree: 23%.

44. Albuquerque, New Mexico.
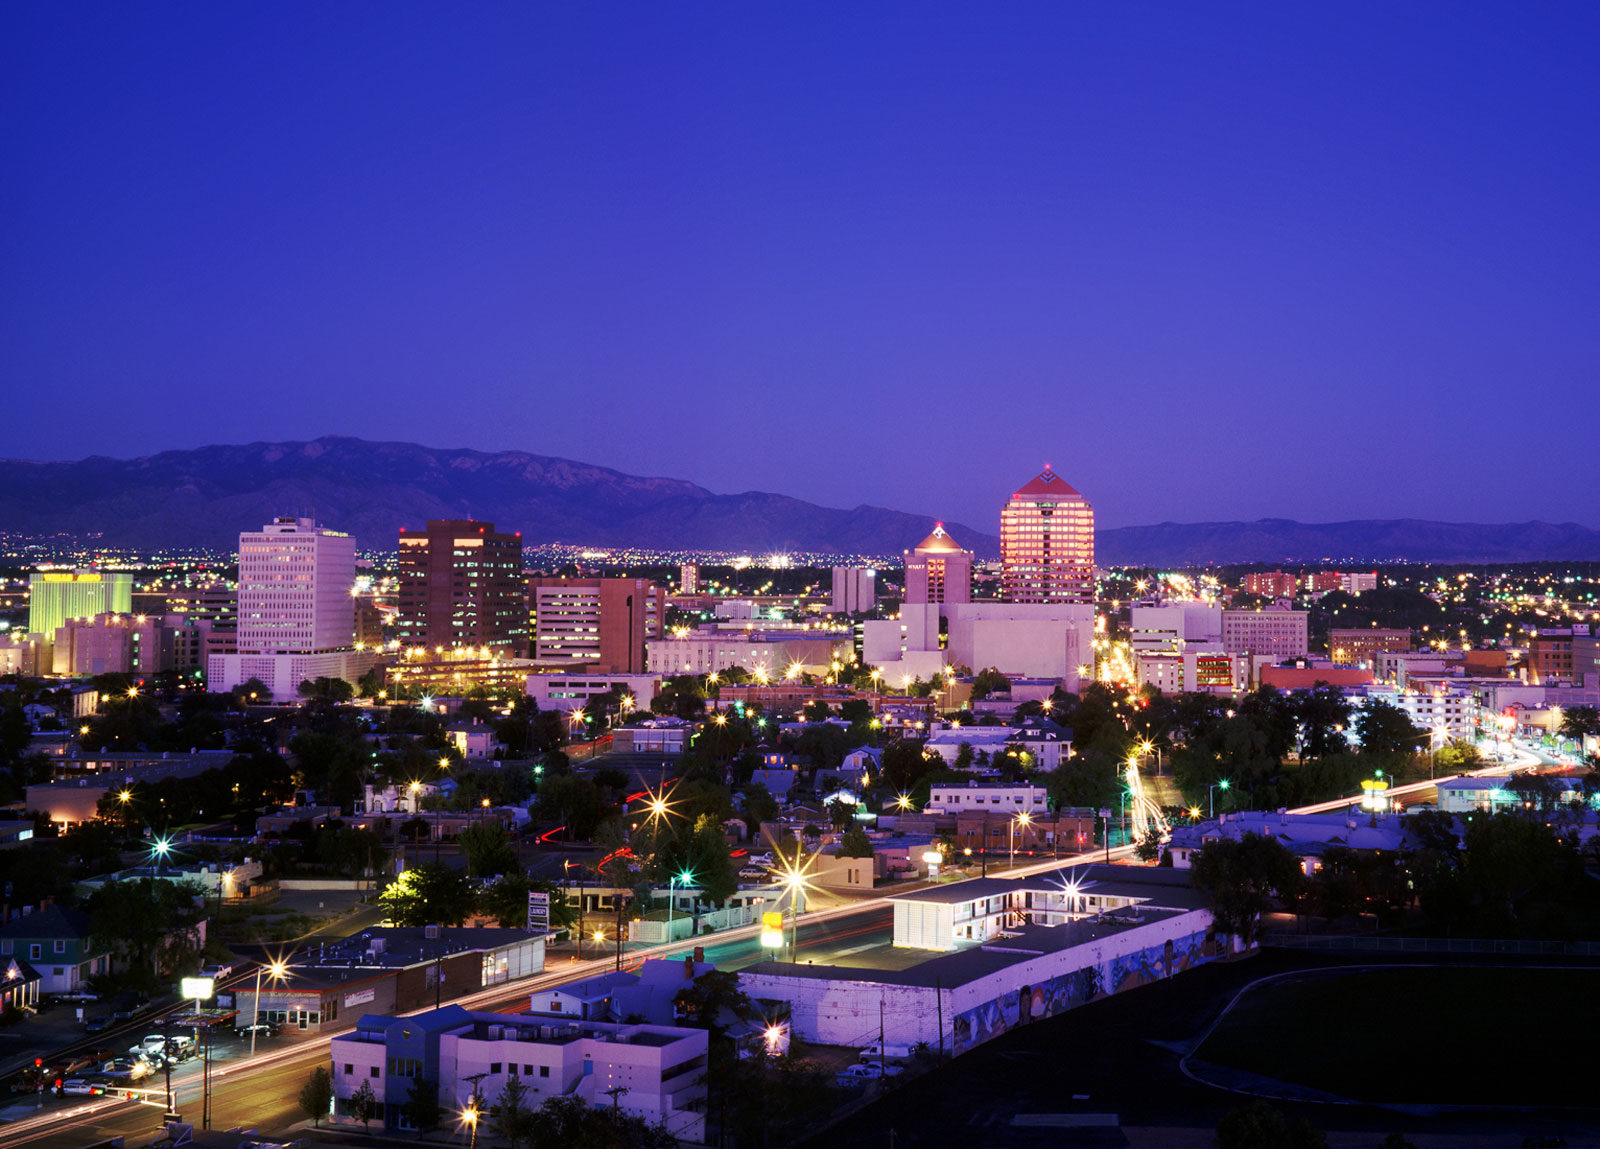
Population: 559,131, Average House Value: $189,200, Poverty Rate: 20%.
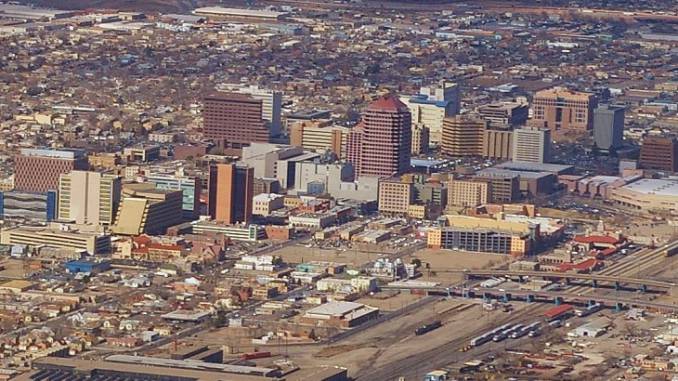
Percentage with at least a bachelors degree: 32.6%.

43. Lawrence, Massachusetts.
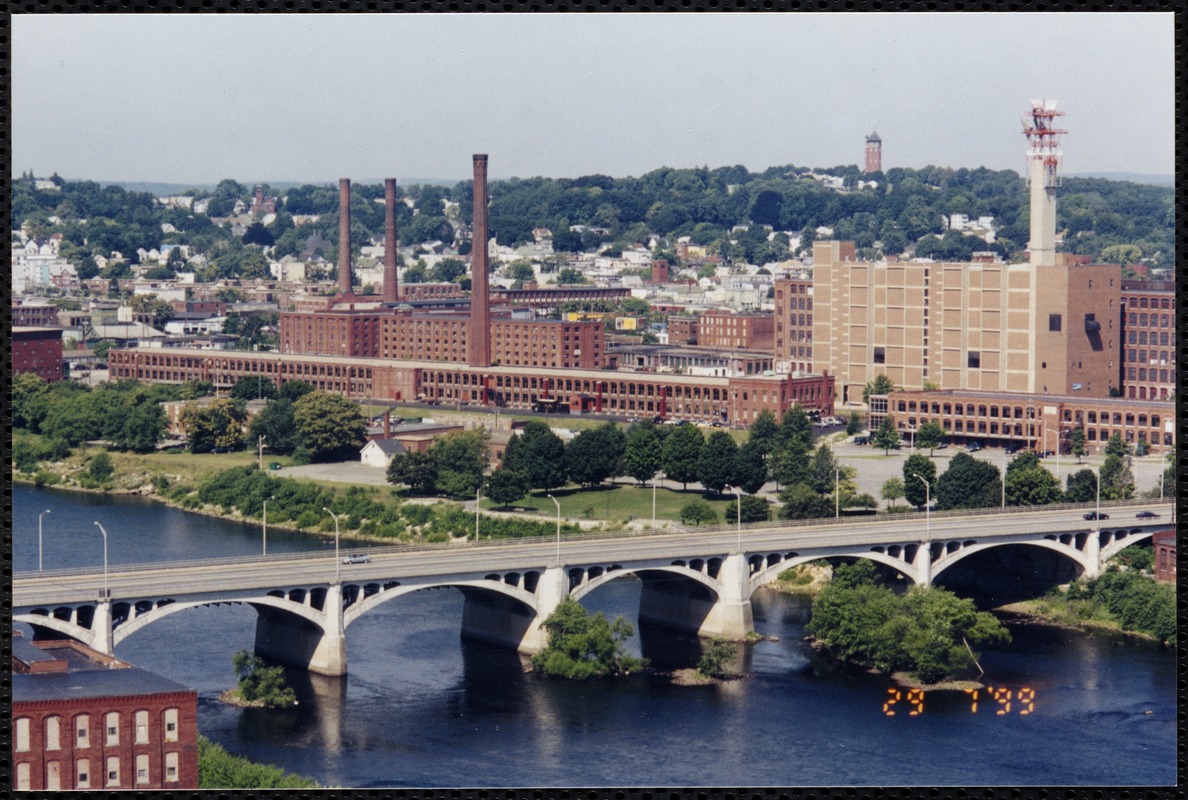
Population: 80,240, Average House Value: $254,800, Poverty Rate: 26.4%.
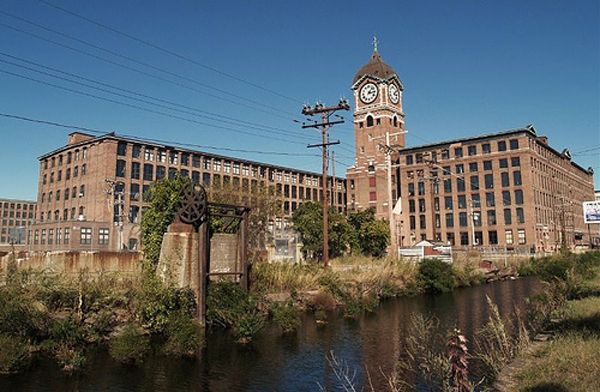
Percentage with at least a bachelors degree: 9.7%.

42. Philadelphia, Pennsylvania.
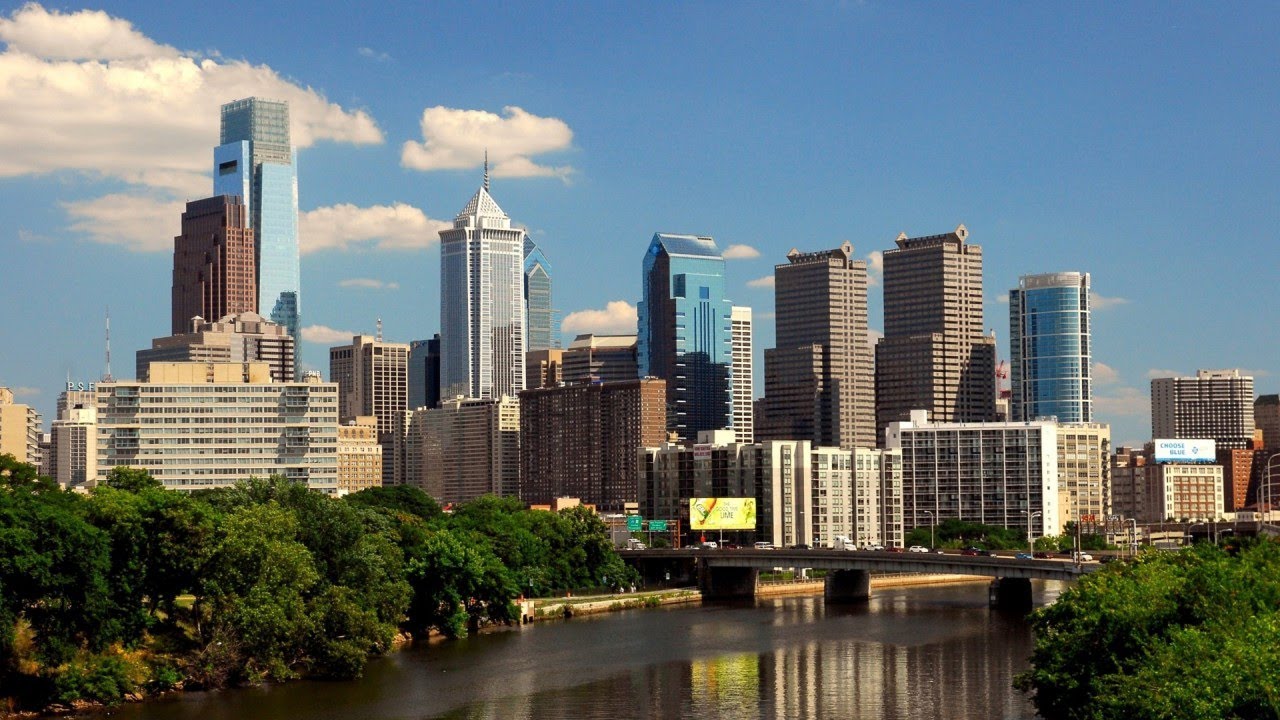
Population: 1,567,442, Average House Value: $150,700, Poverty Rate: 25.8%.
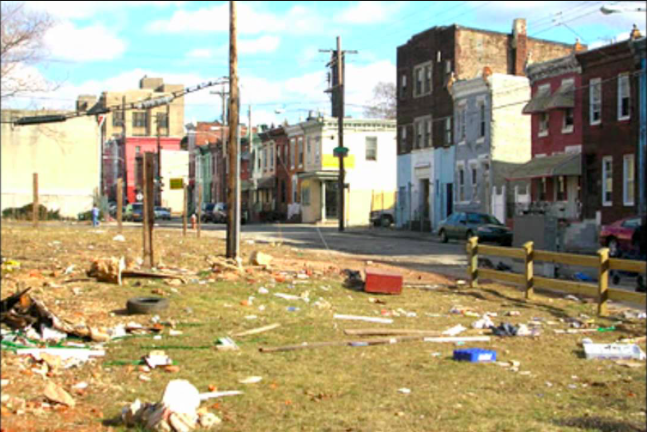
Percentage with at least a bachelors degree: 27.4%.

41. Lubbock, Texas.
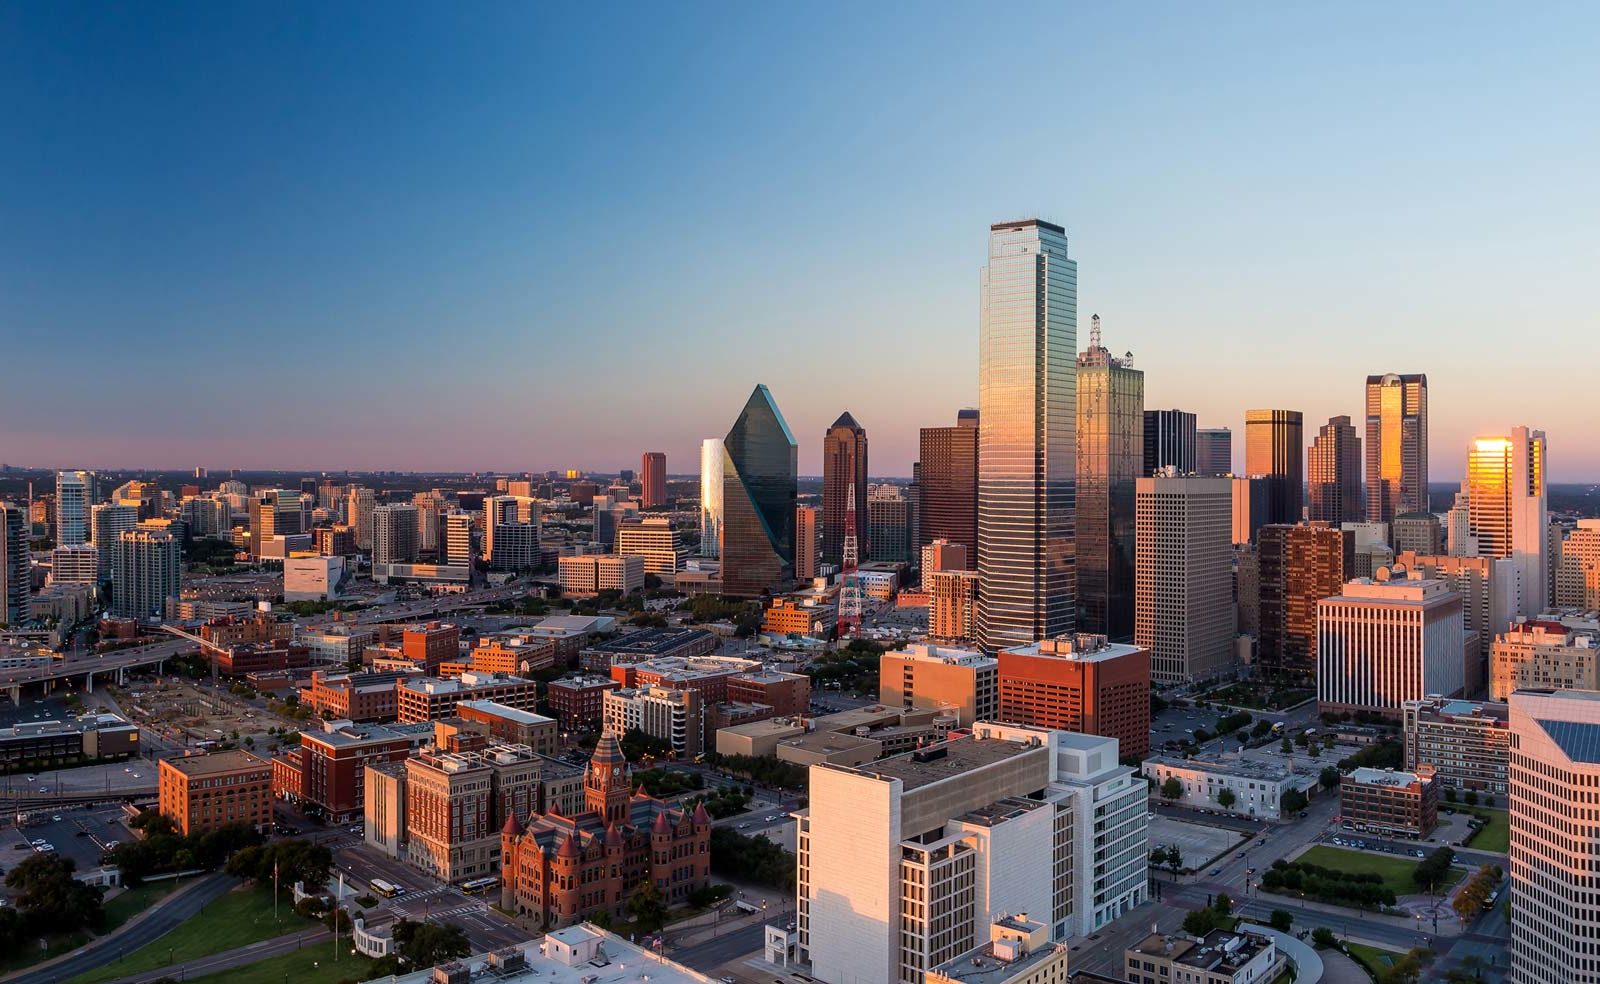
Population: 249,051, Average House Value: $126,900, Poverty Rate: 22.4%.
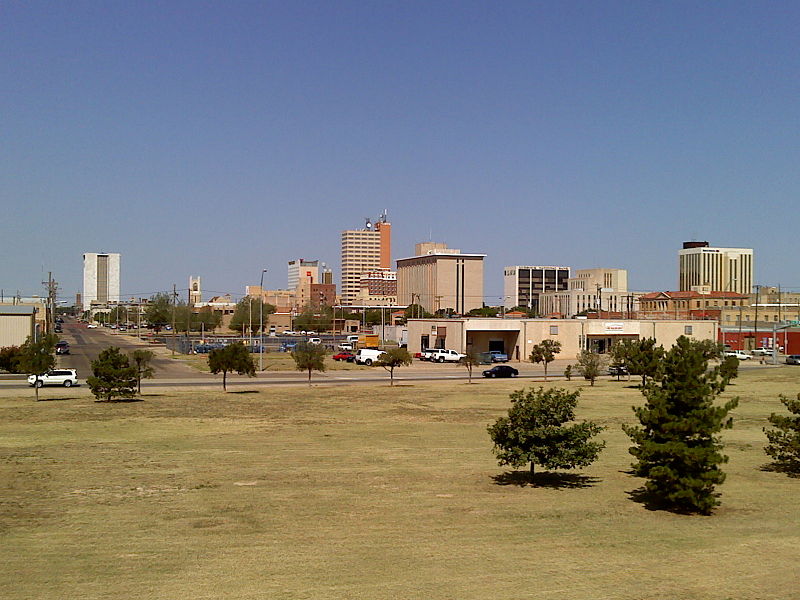
Percentage with at least a bachelors degree: 26.8%.

40. Medford, Oregon.

Population: 79,795, Average House Value: $232,400, Poverty Rate: 22.3%.
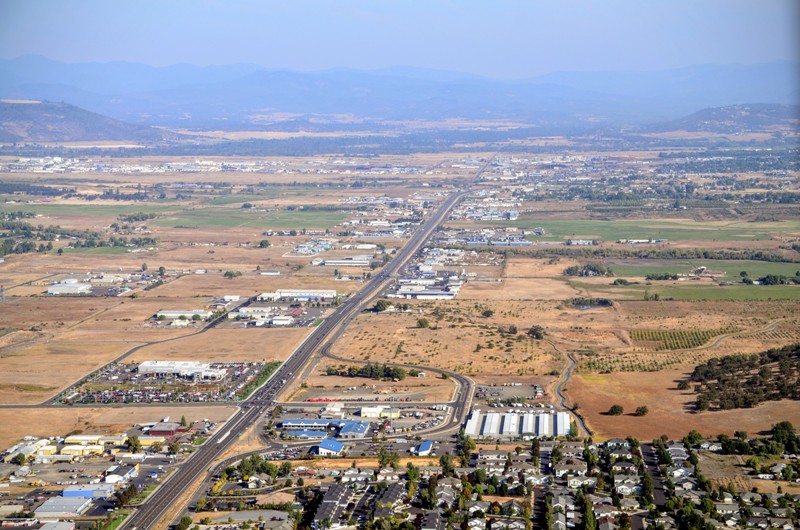
Percentage with at least a bachelors degree: 20.9%.

39. Indianapolis, Indiana.
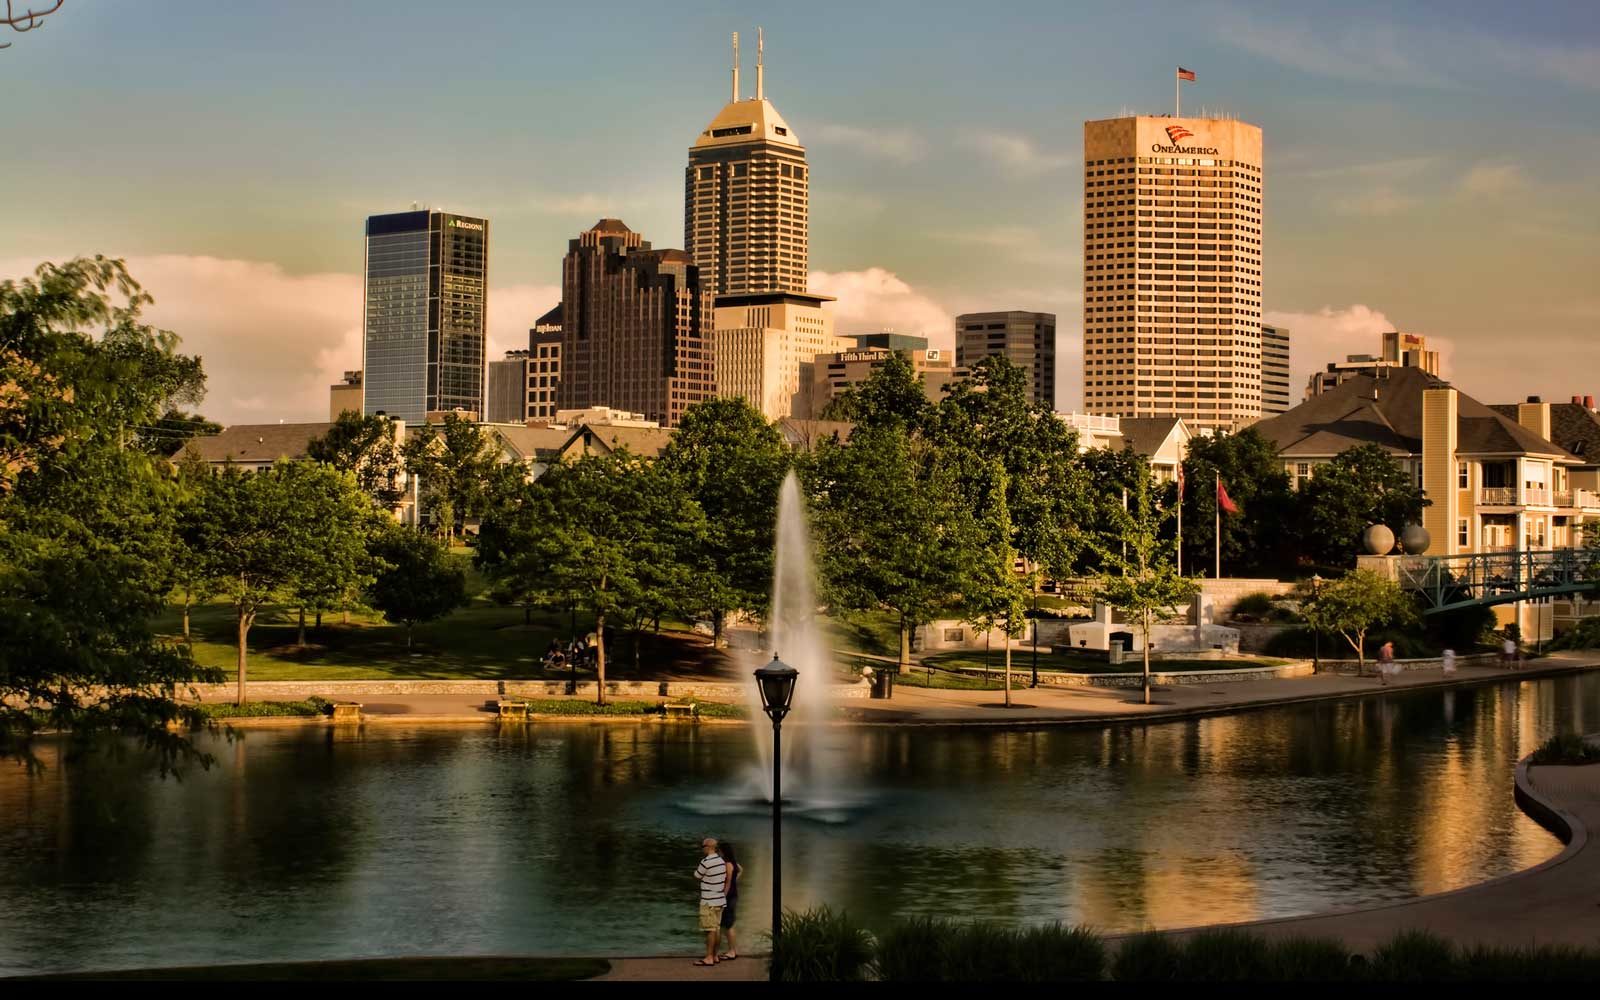
Population: 848,423, Average House Value: $123,500, Poverty Rate: 20.6%.
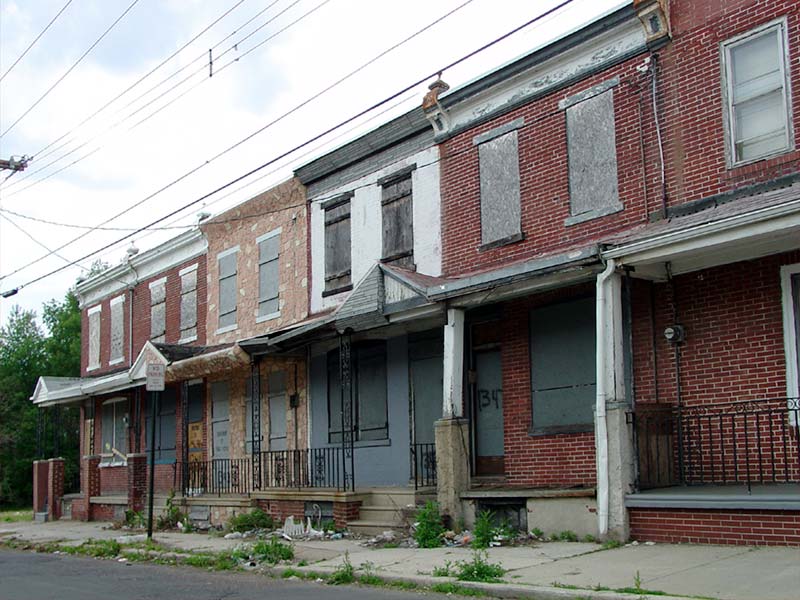
Percentage with at least a bachelors degree: 29.4%.

38. Fall River, Massachusetts.
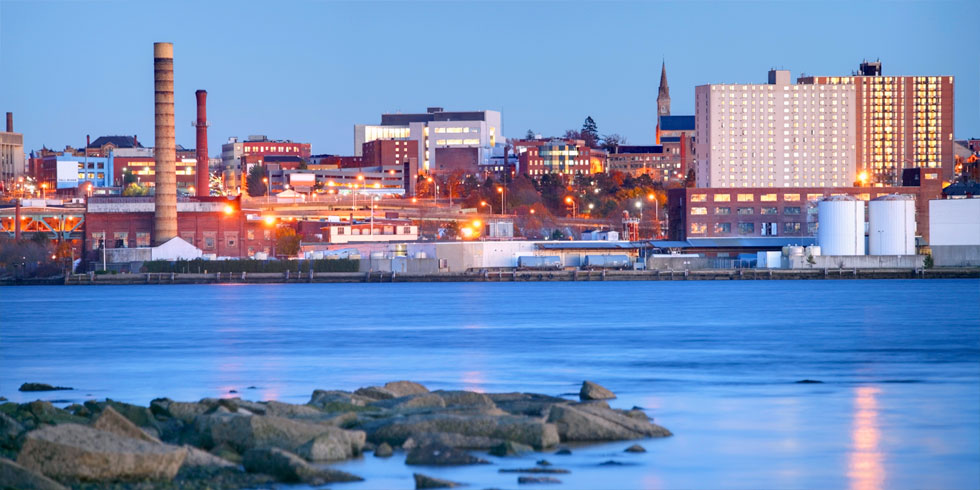
Population: 88,770, Average House Value: $233,000, Poverty Rate: 21.5%.
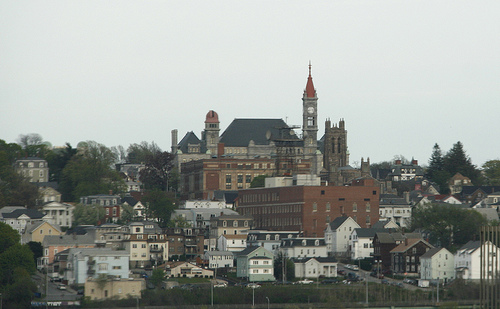
Percentage with at least a bachelors degree: 13.5%.

37. Atlanta, Georgia.
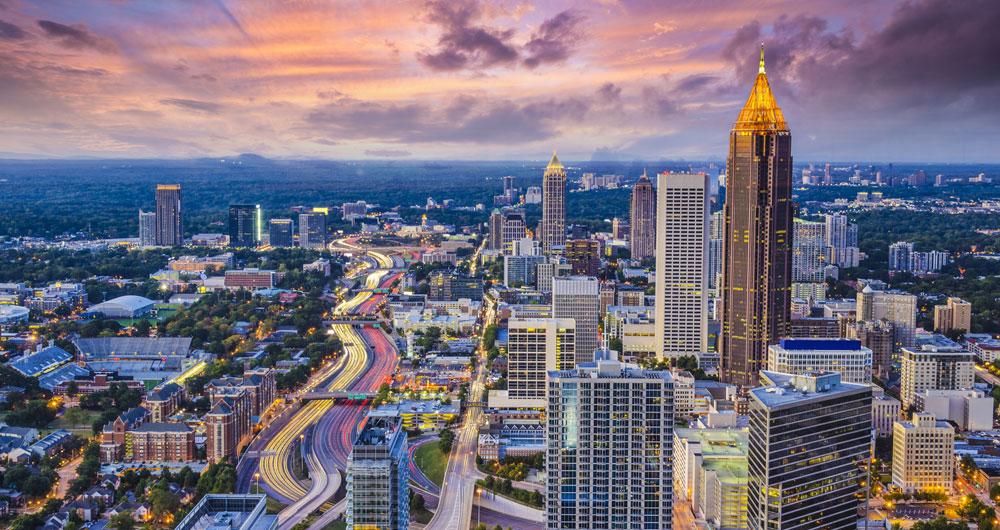
Population: 463,875, Average House Value: $241,200, Poverty Rate: 22.5%.
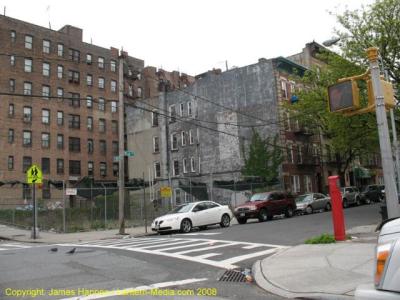
Percentage with at least a bachelors degree: 48.3%.
36. Waterbury, Connecticut.
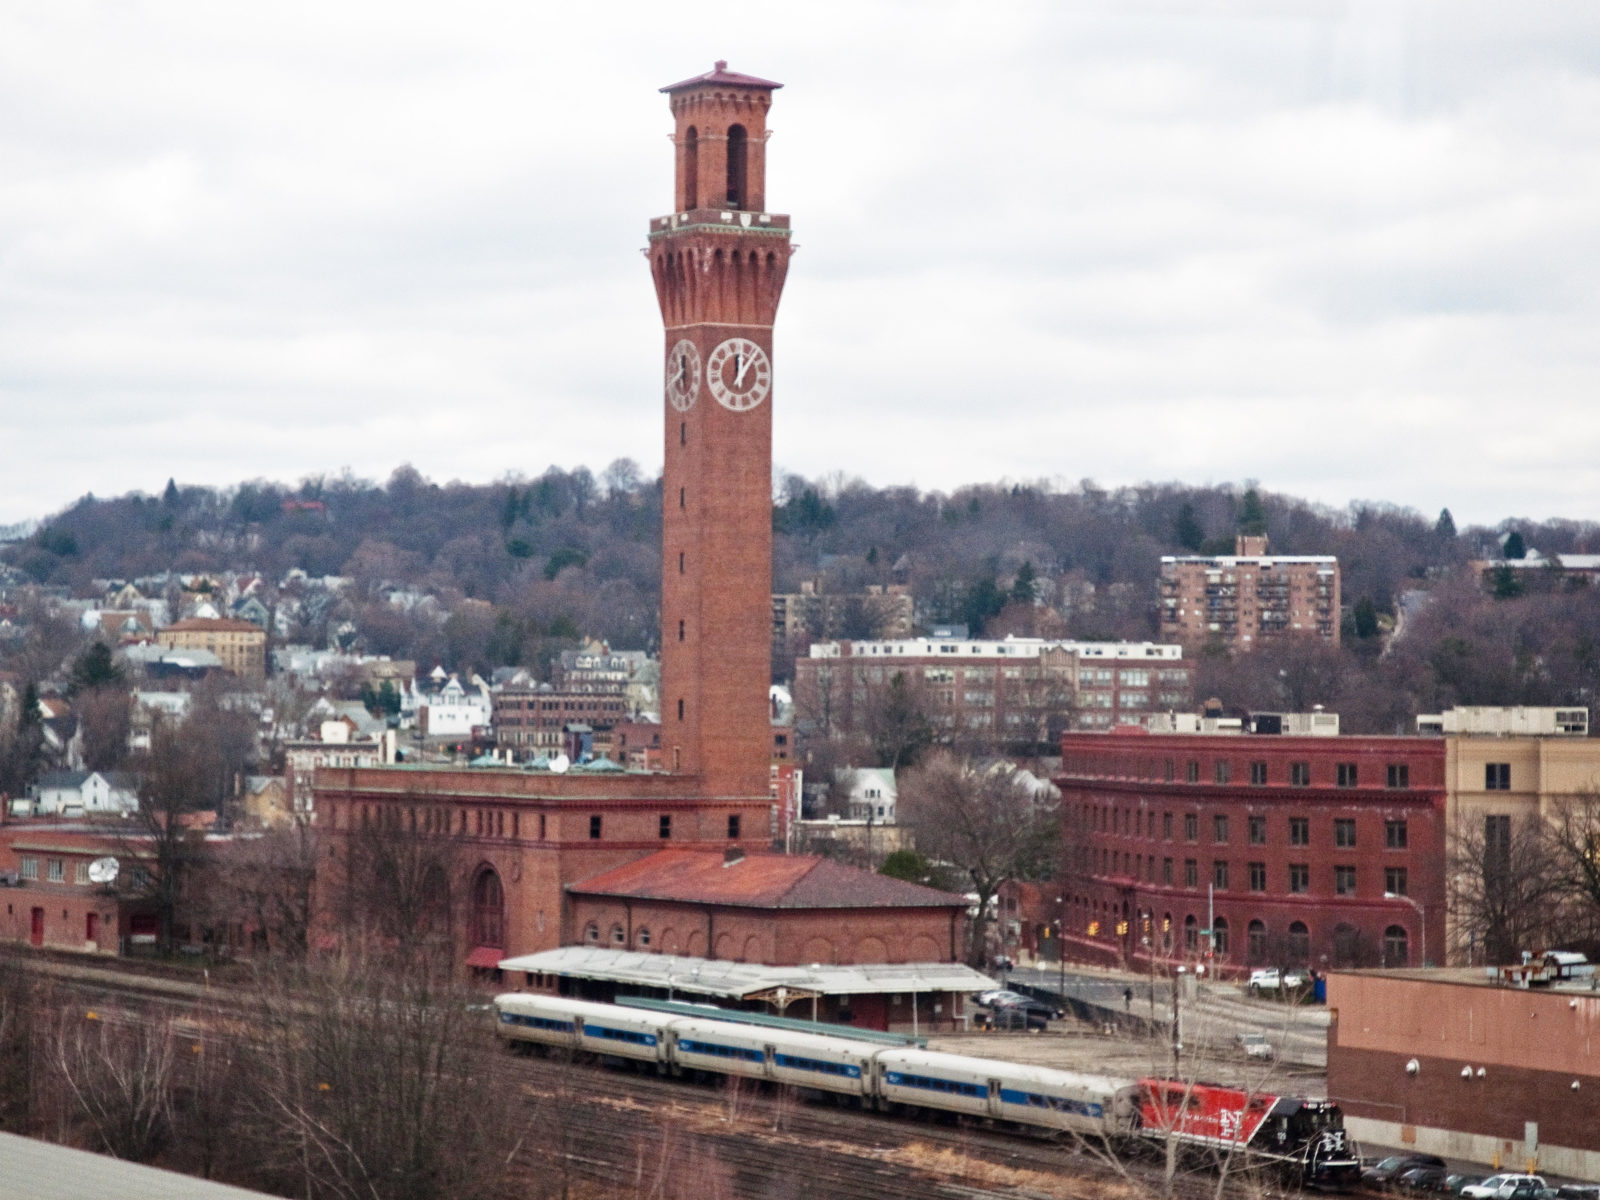
Population: 108,807, Average House Value: $129,400, Poverty Rate: 27.3%.
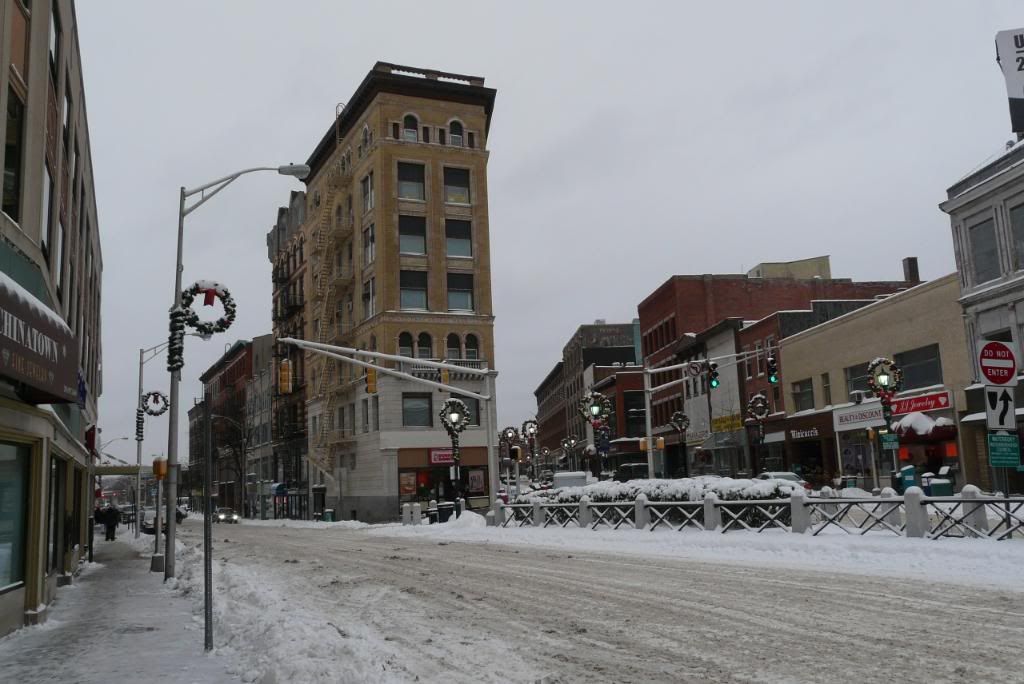
Percentage with at least a bachelors degree: 13.1%.

35. Lansing, Michigan.
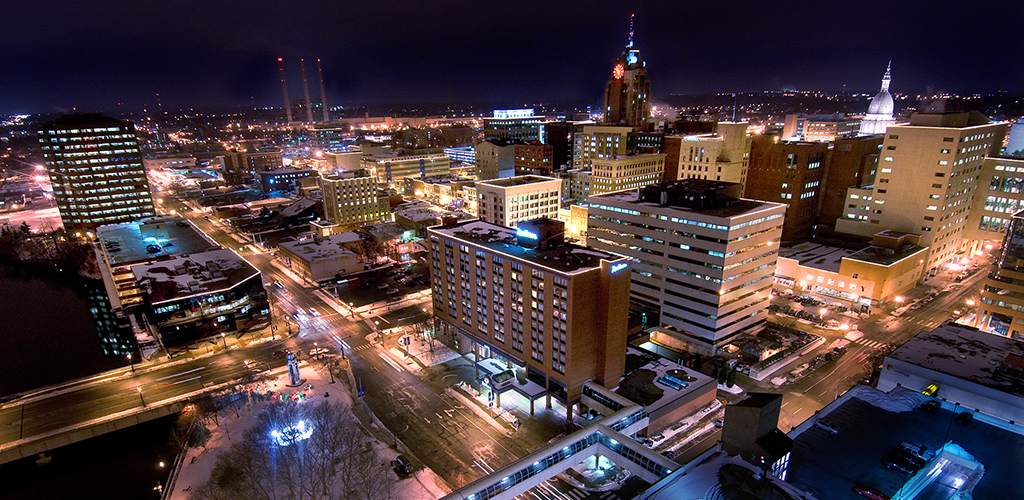
Population: 114,110, Average House Value: $75,800, Poverty Rate: 26.8%.
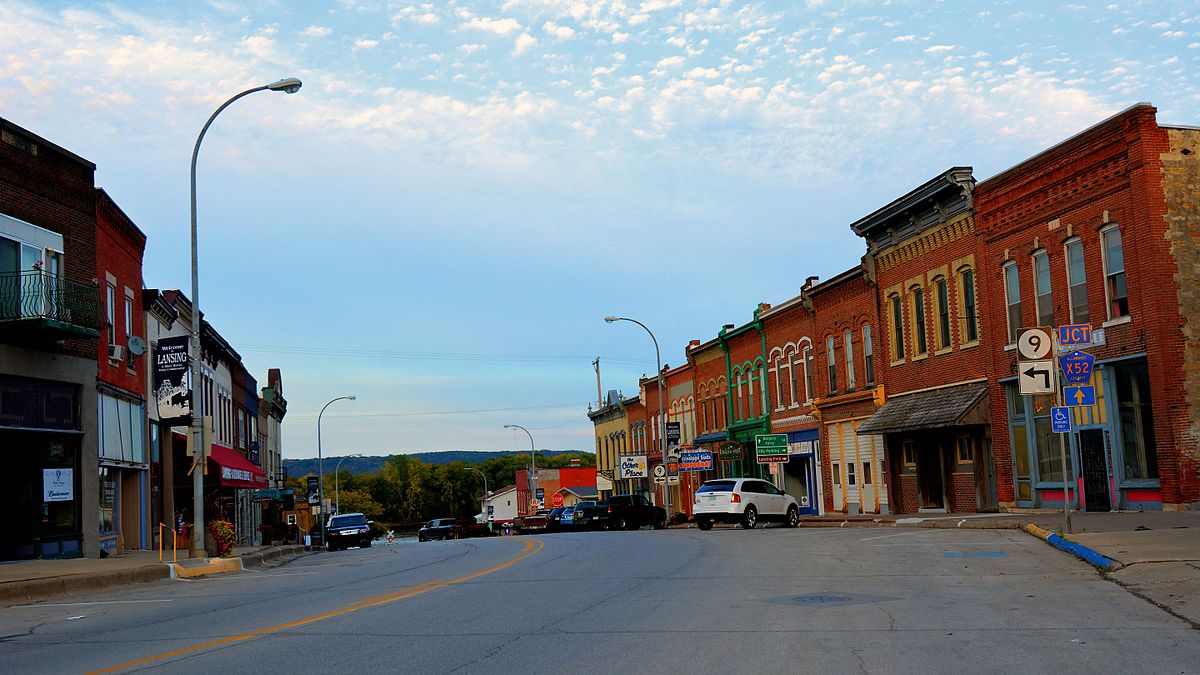
Percentage with at least a bachelors degree: 26%.
34. Rochester, New York.

Population: 209,808, Average House Value: $76,900, Poverty Rate: 33.2%.
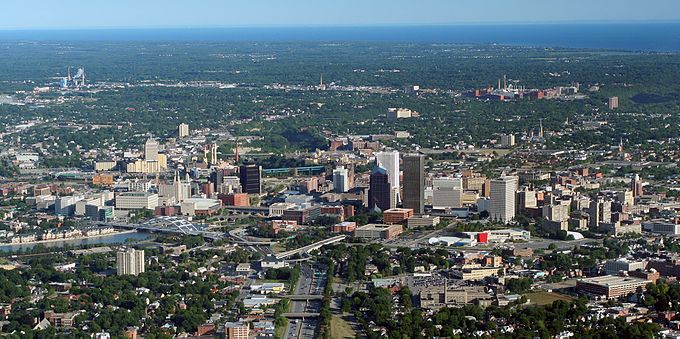
Percentage with at least a bachelors degree: 21.6%.
33. Reading, Pennsylvania.
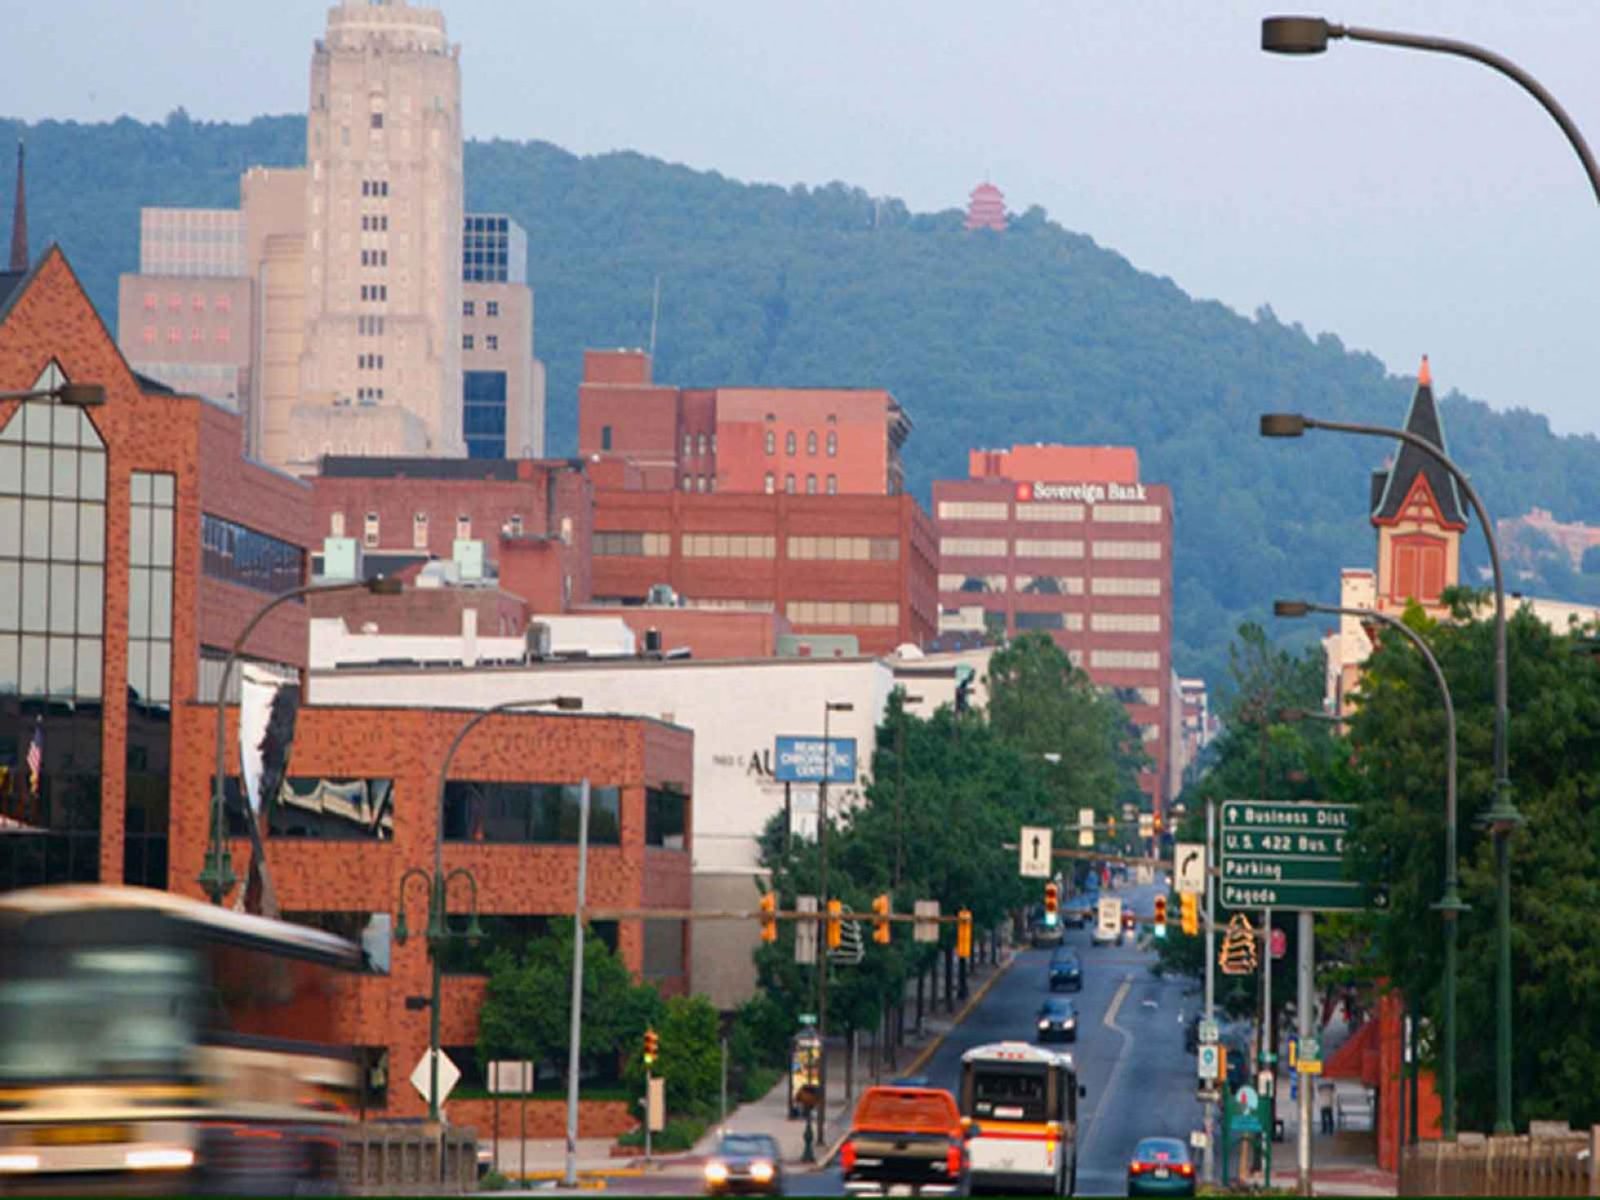
Population: 87,873, Average House Value: $69,100, Poverty Rate: 38.8%.
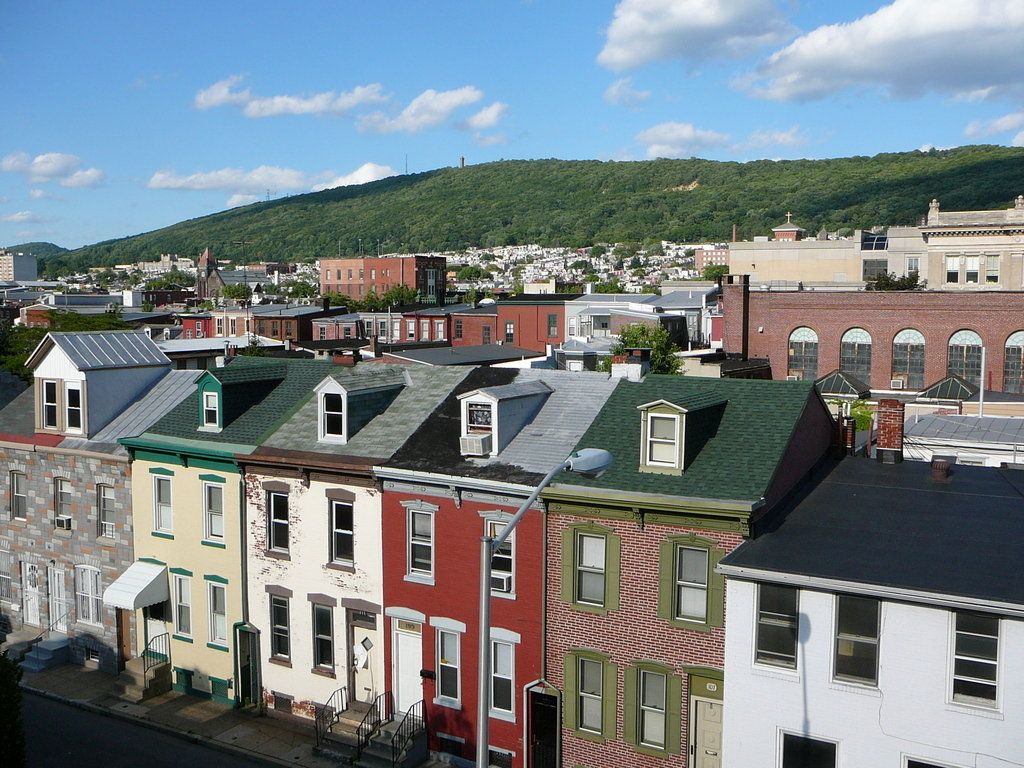
Percentage with at least a bachelors degree: 11.5%.
32. Salt Lake City, Utah.
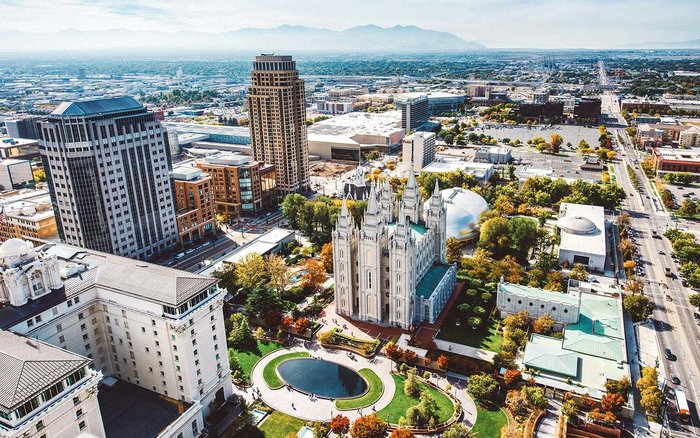
Population: 192,660, Average House Value: $262,400, Poverty Rate: 19.1%.
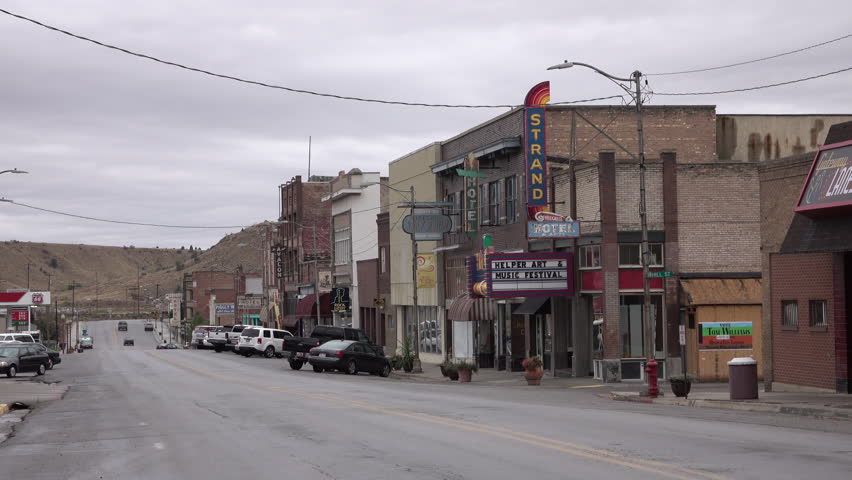
Percentage with at least a bachelors degree: 44.4%.
31. Syracuse, New York.
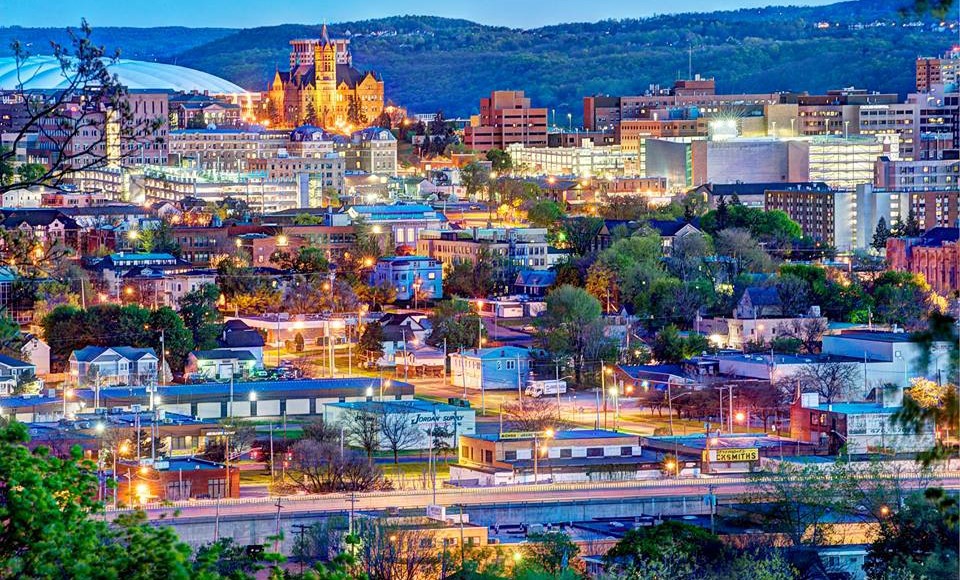
Population: 144,152, Average House Value: $93,100, Poverty Rate: 31%.
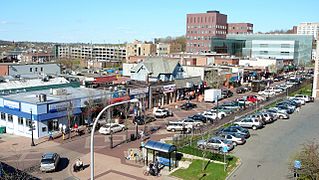
Percentage with at least a bachelors degree: 29%.
3o. Chattanooga, Tennessee.

Population: 176,597, Average House Value: $151,400, Poverty Rate: 21.7%.
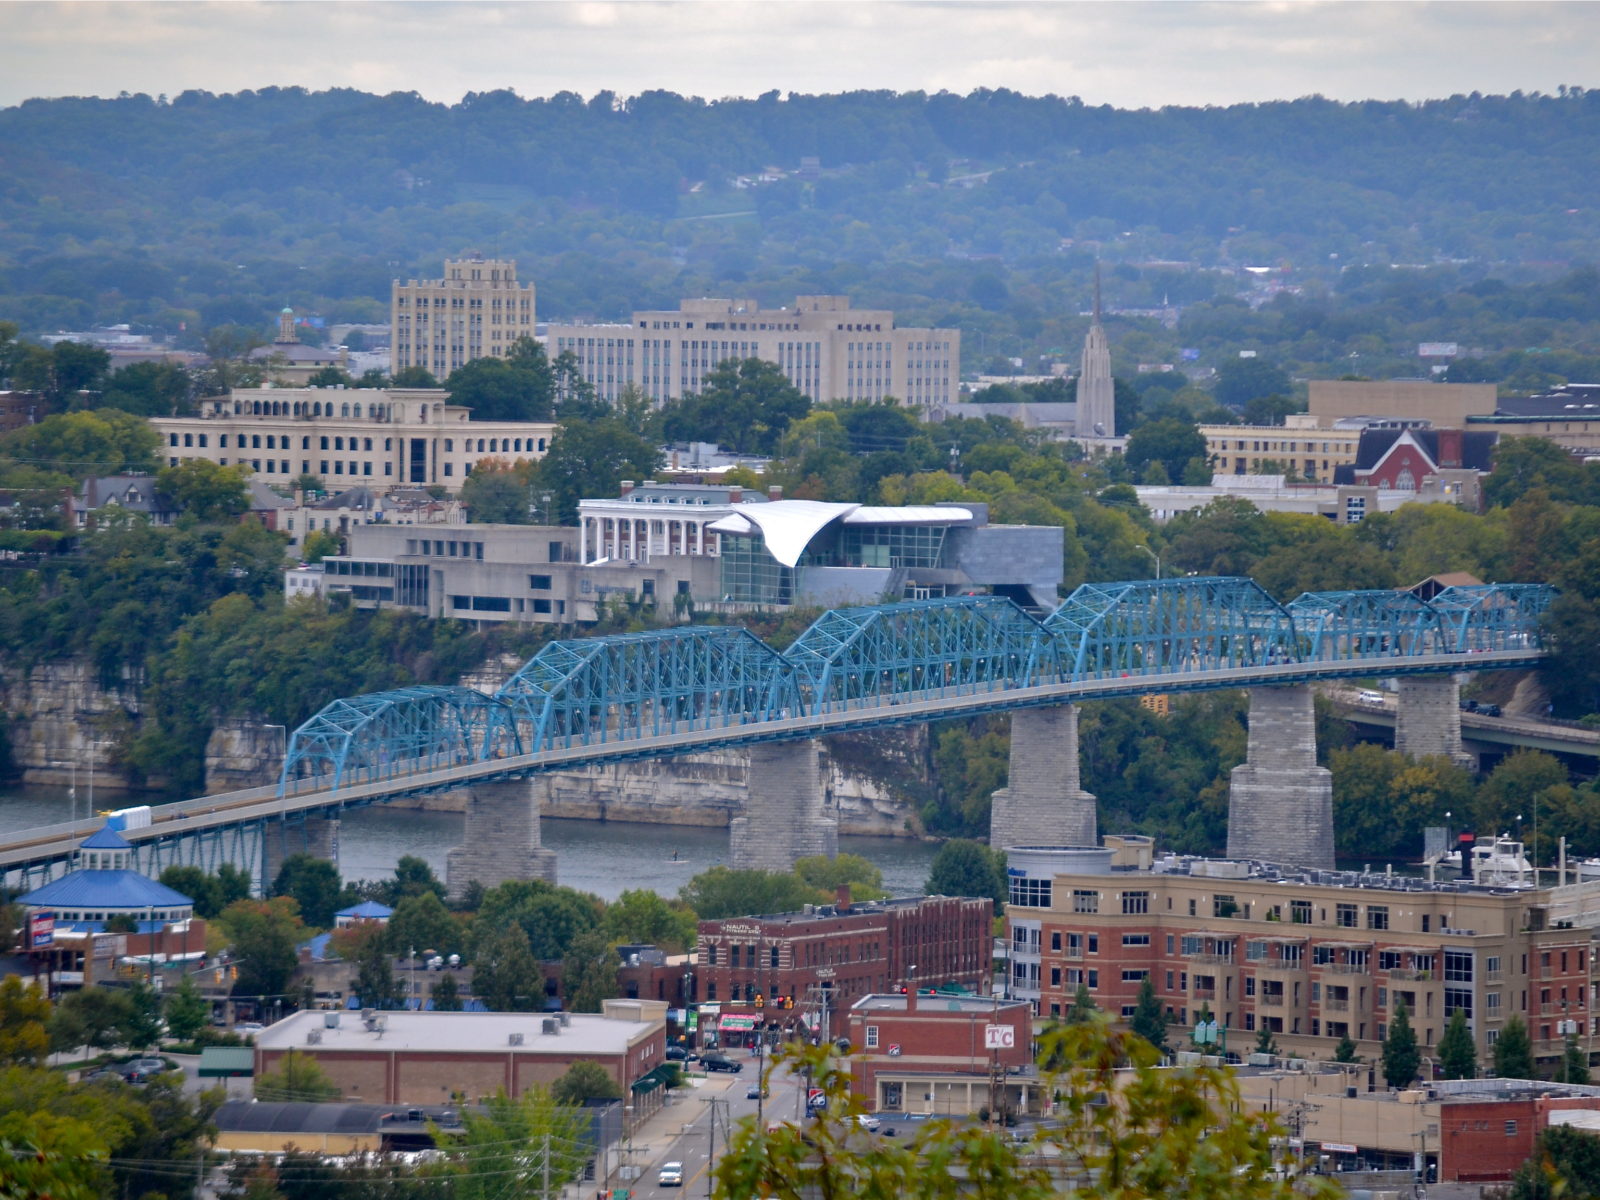
Percentage with at least a bachelors degree: 26%.
29. Gary, Indiana.
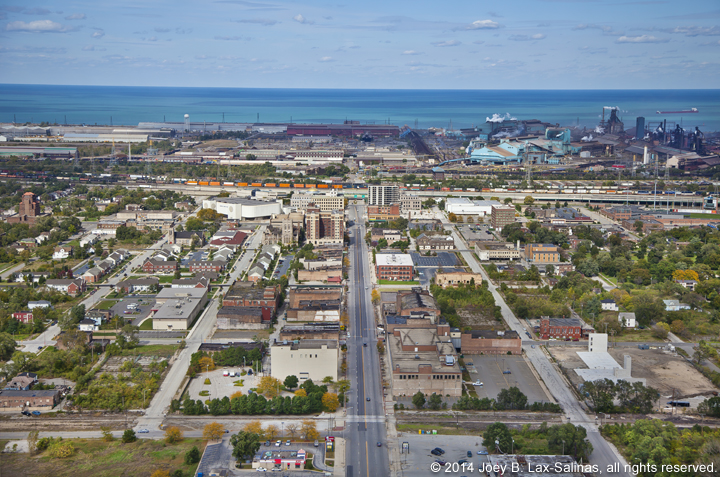
Population: 77,354, Average House Value: $68,000, Poverty Rate: 29.8%.

Percentage with at least a bachelors degree: 12.6%.
28. Tucson, Arizona.
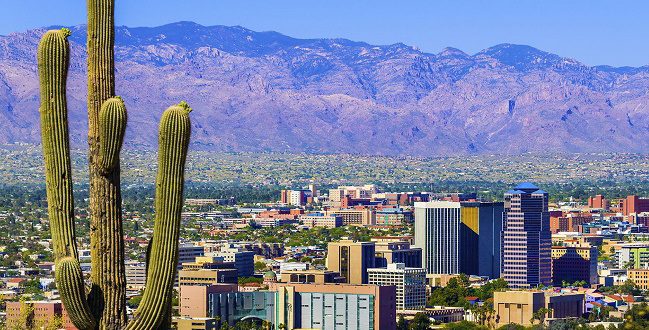
Population: 531,674, Average House Value: $139,400, Poverty Rate: 25.2%.
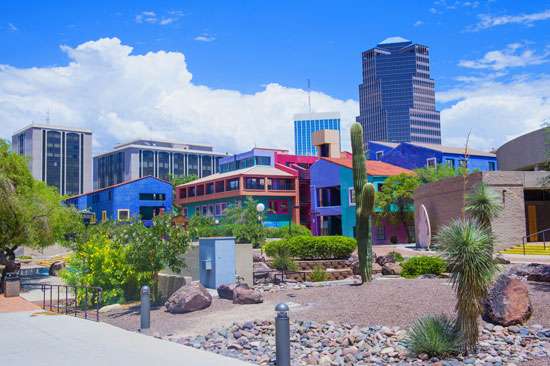
Percentage with at least a bachelors degree: 26.5%.
27. Paterson, New Jersey.
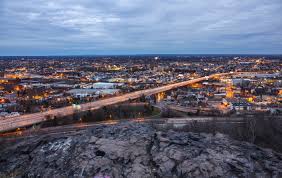
Population: 147,757, Average House Value: $226,300, Poverty Rate: 30.1%.
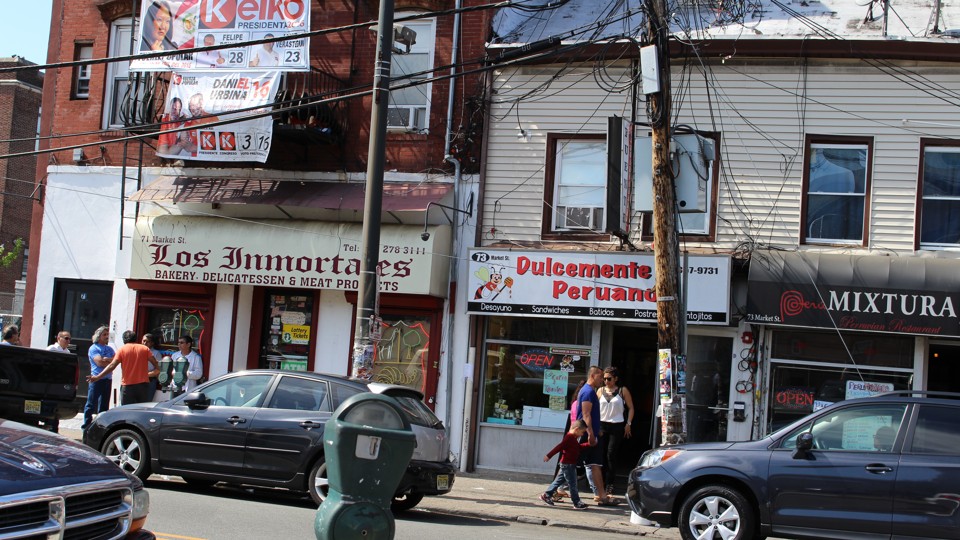
Percentage with at least a bachelors degree: 9.1%.
26. Little Rock, Arkansas.
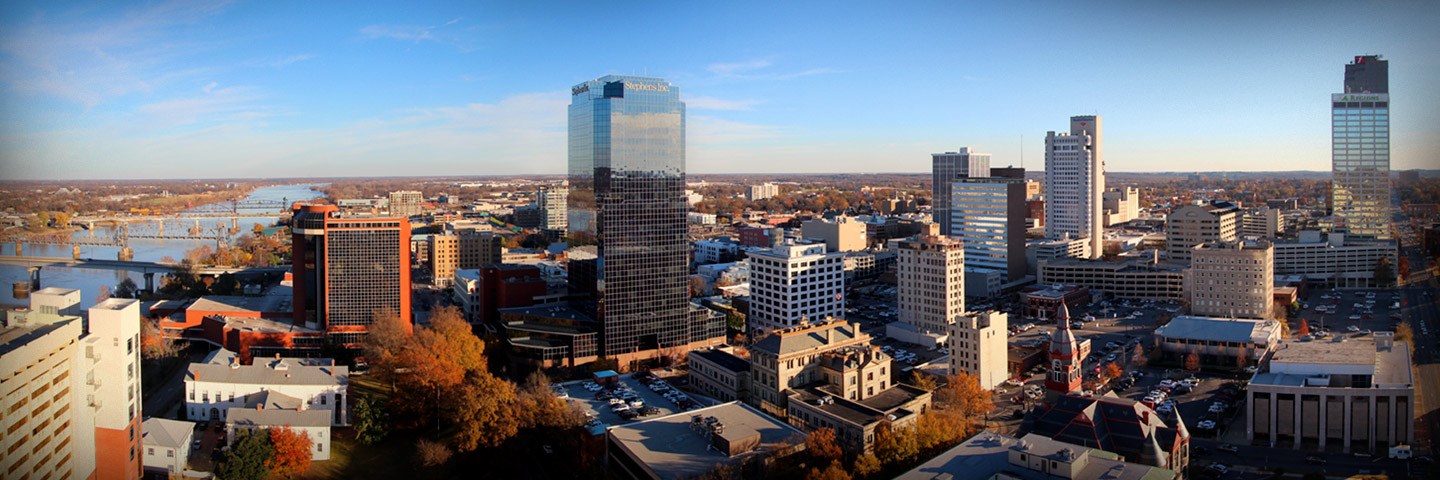
Population: 97,986, Average House Value: $162,000, Poverty Rate: 19.2%.
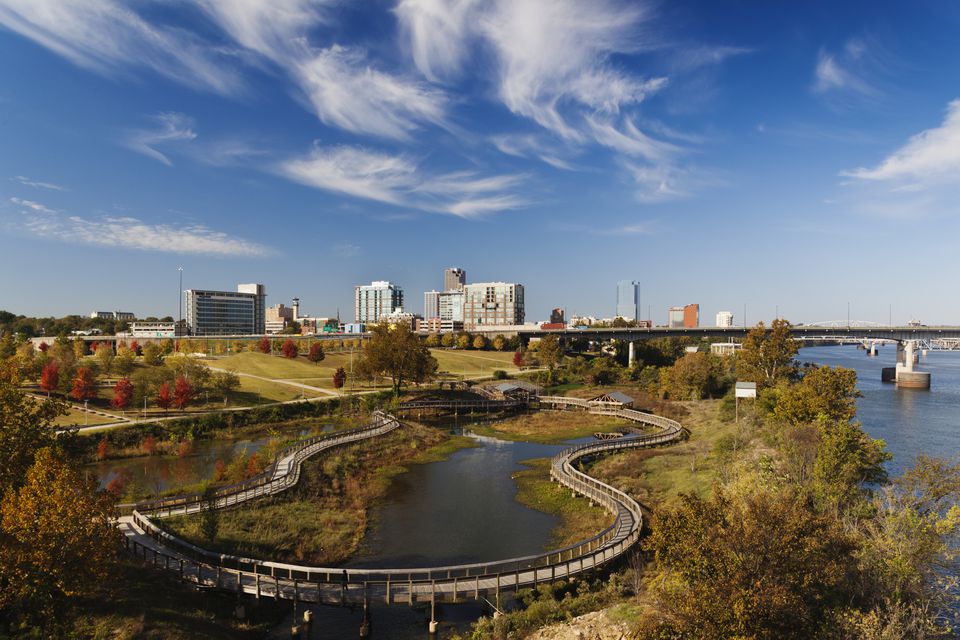
Percentage with at least a bachelors degree: 39.7%.
25. Cincinnati, Ohio.

Population: 298,537, Average House Value: $119,000, Poverty Rate: 27.4%.
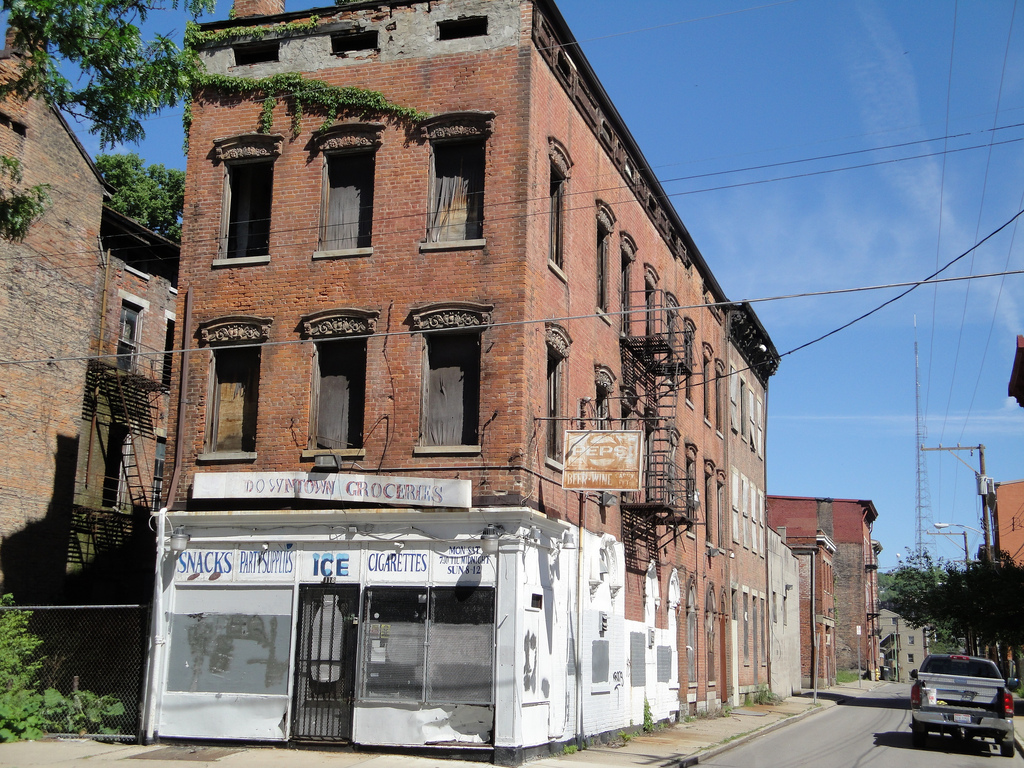
Percentage with at least a bachelors degree: 34.3%.
24. Fort Smith, Arkansas.
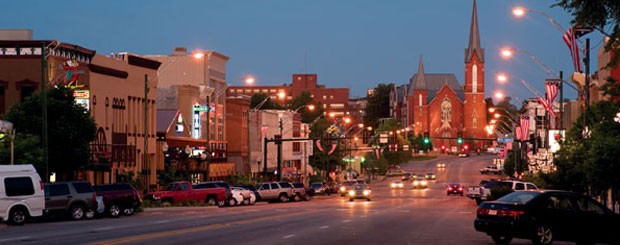
Population: 88,195, Average House Value: $116,300, Poverty Rate: 29.8%.
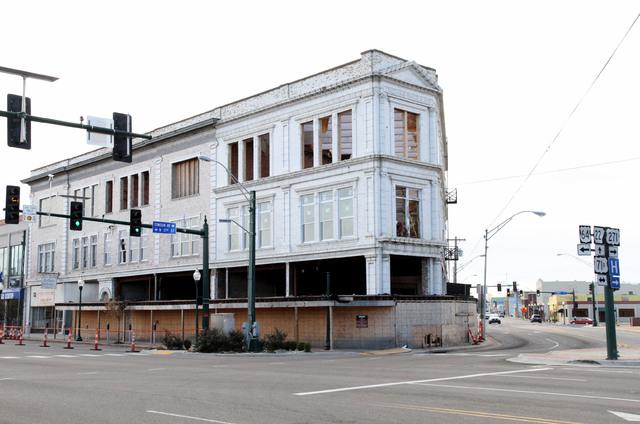
Percentage with at least a bachelors degree: 19%.
23. Knoxville, Tennessee.
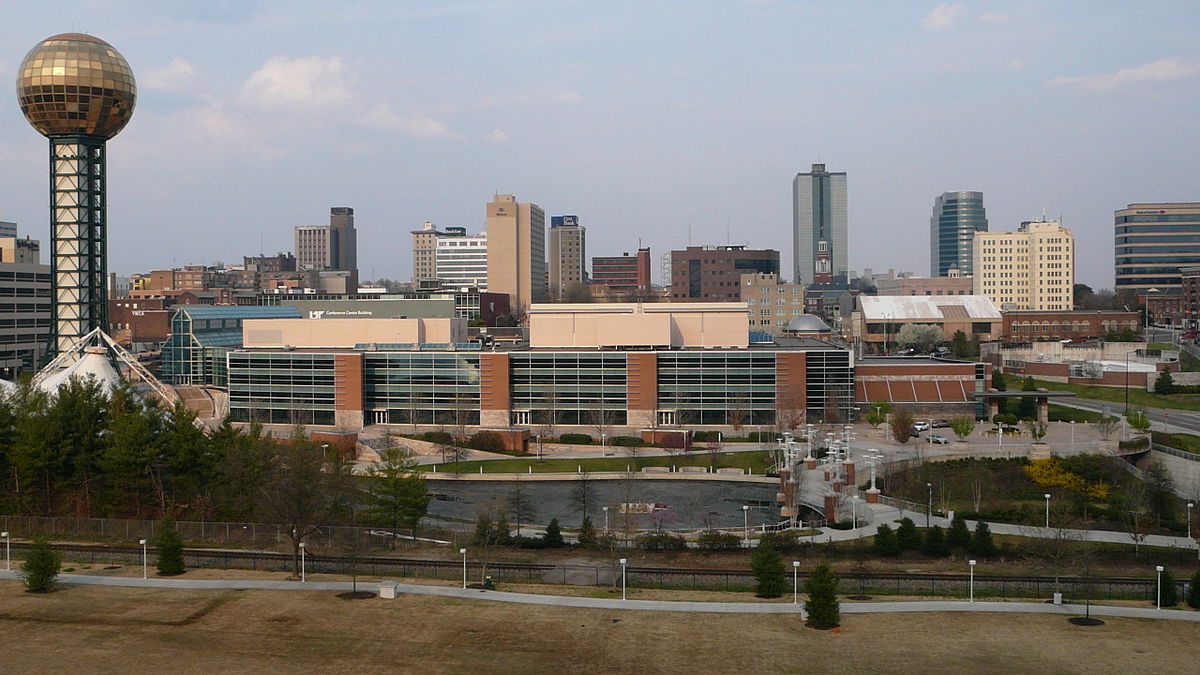
Population: 185,312, Average House Value: $125,900, Poverty Rate: 25.8%.
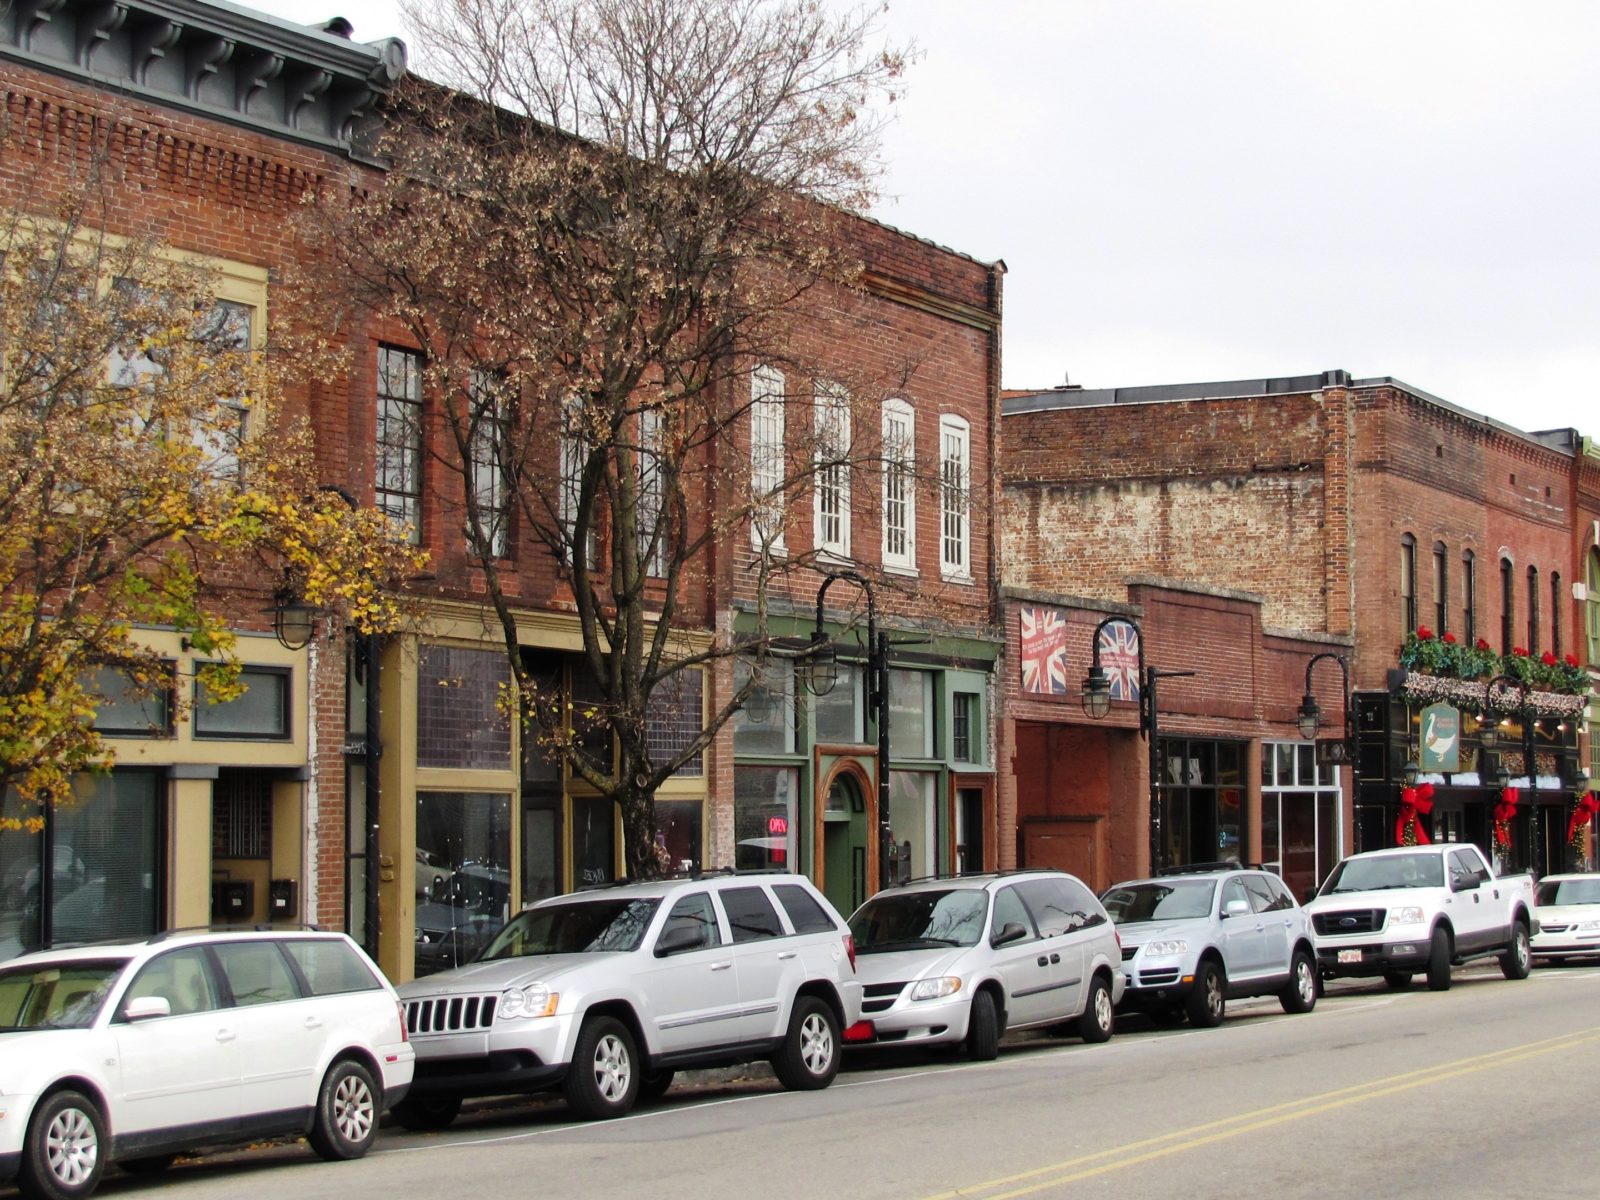
Percentage with at least a bachelors degree: 29.2%.
22. Buffalo, New York.
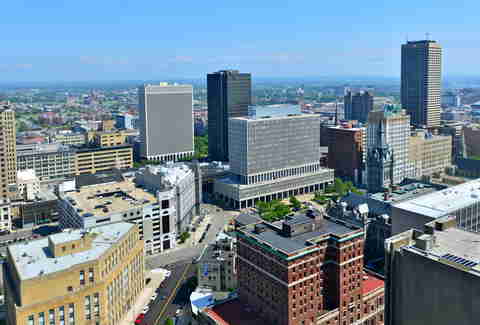
Population: 258,066, Average House Value: $75,800, Poverty Rate: 33%.
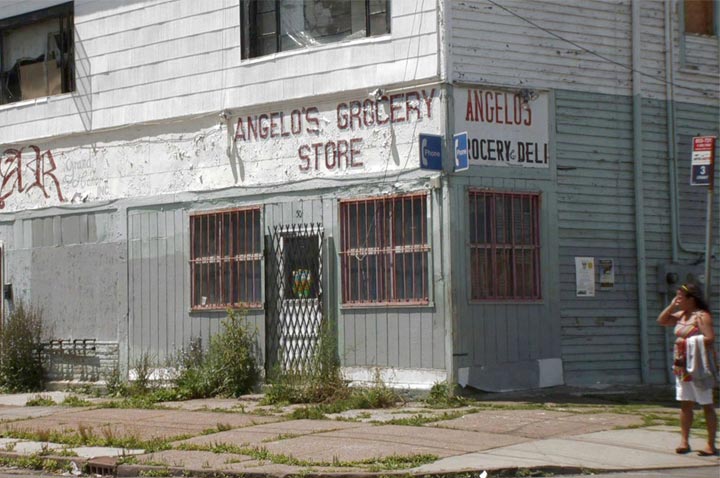
Percentage with at least a bachelors degree: 23.9%.
21. Youngstown, Ohio.
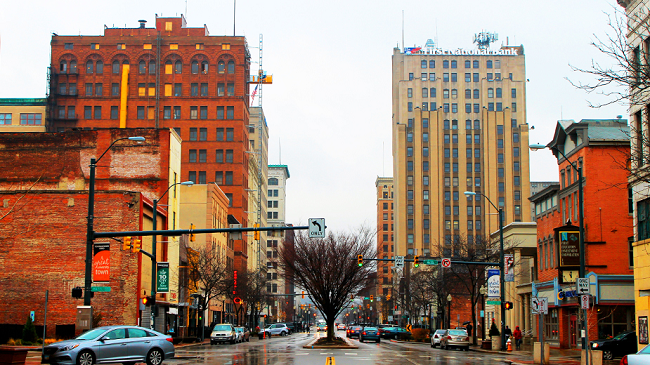
Population: 64,609, Average House Value: $42,600, Poverty Rate: 35.7%.
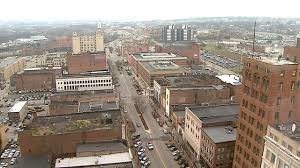
Percentage with at least a bachelors degree: 12.1%.
2o. Canton, Ohio.
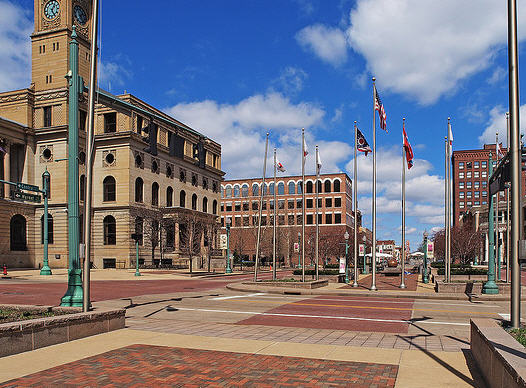
Population: 71,895, Average House Value: $62,700, Poverty Rate: 31.6%.
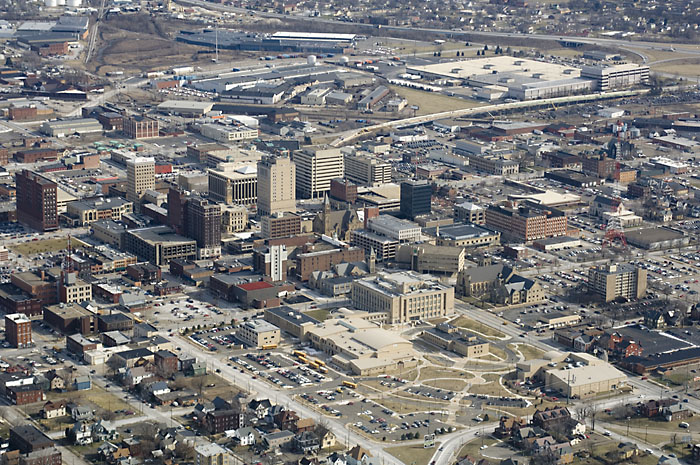
Percentage with at least a bachelors degree: 14.4%.
19. Pueblo, Colorado.
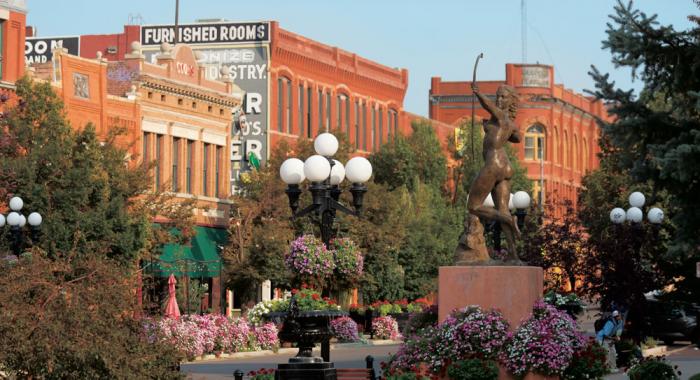
Population: 109,419, Average House Value: $124,700, Poverty Rate: 25.1%.
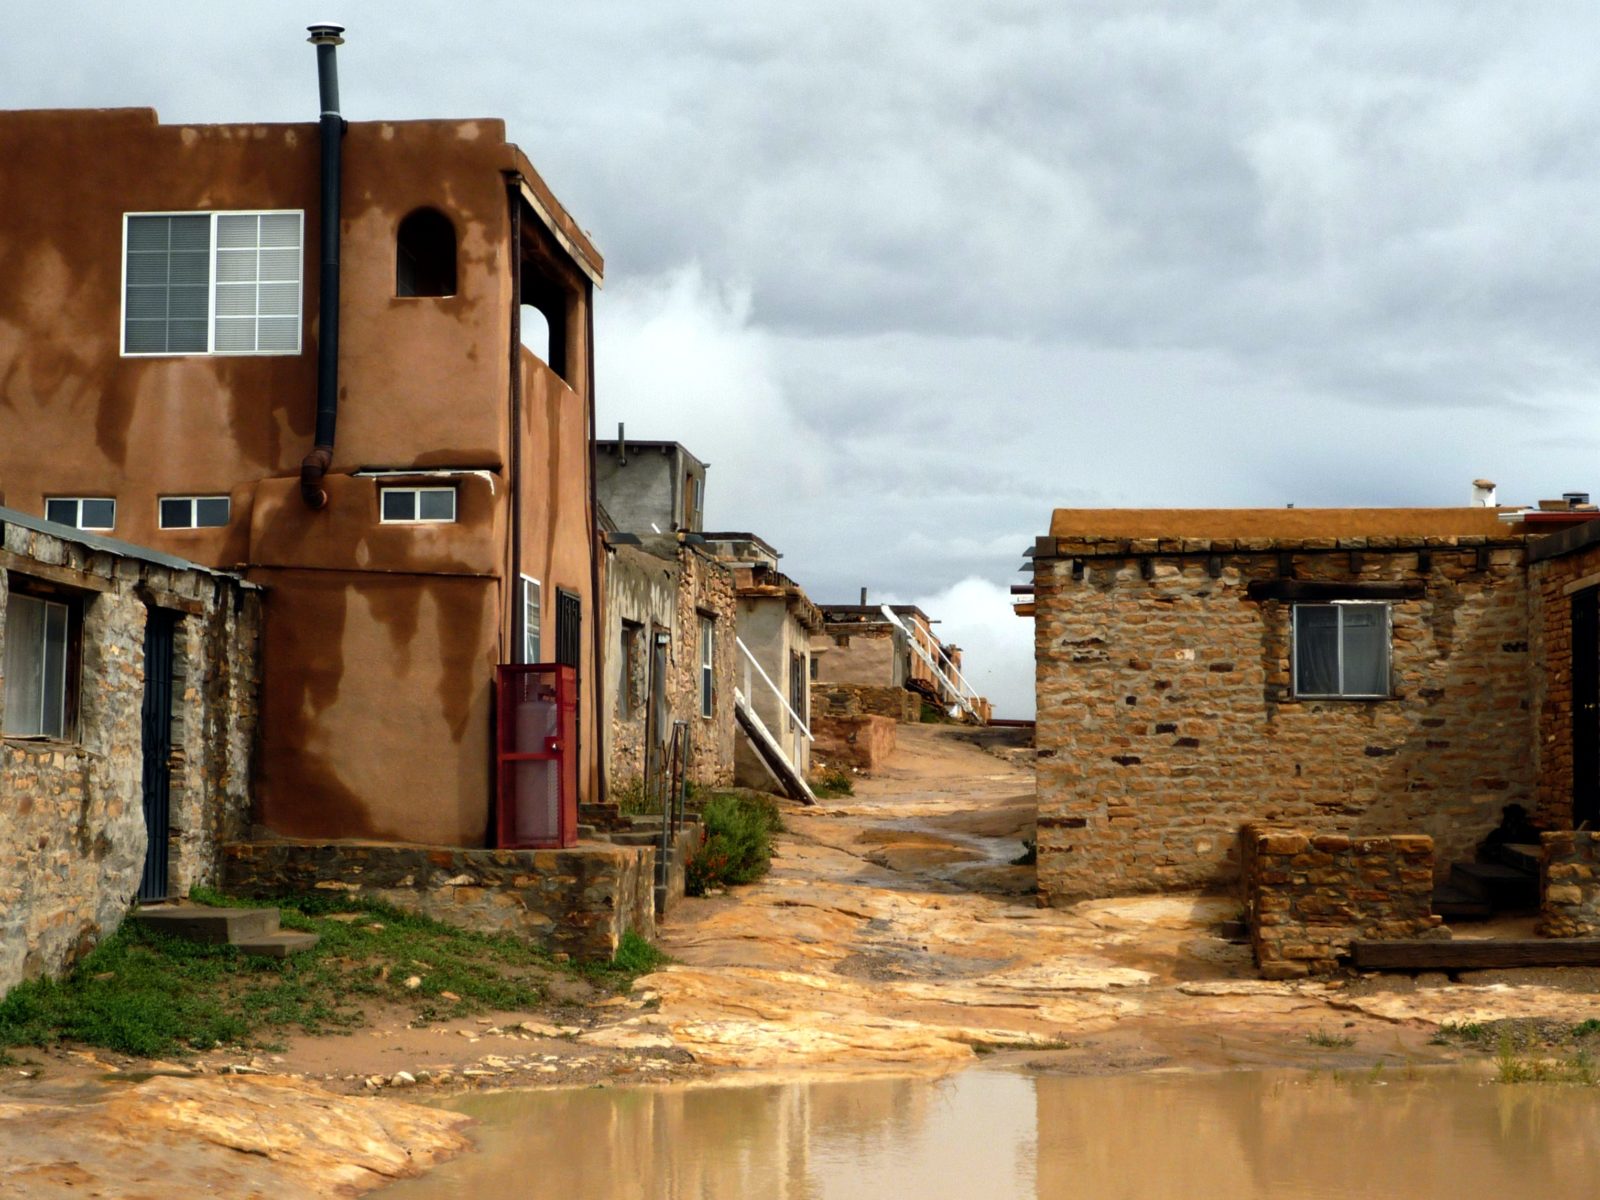
Percentage with at least a bachelors degree: 18.4%.
18. Springfield, Massachussets.
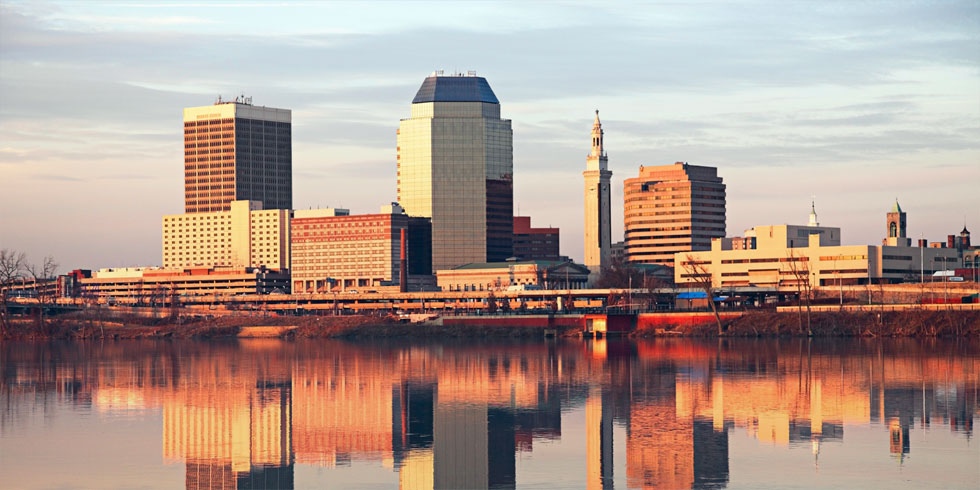
Population: 154,336, Average House Value: $146,700, Poverty Rate: 27.3%.
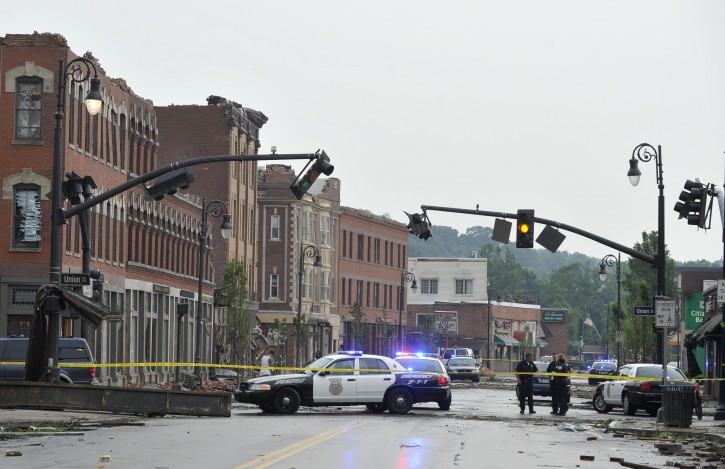
Percentage with at least a bachelors degree: 17.5%.
17. Miami Beach, Florida.
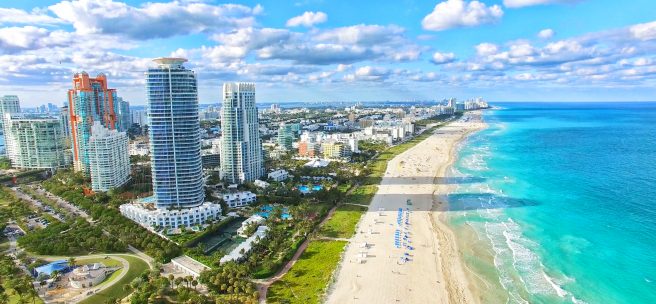
Population: 92,331, Average House Value: $460,000, Poverty Rate: 5.1%.
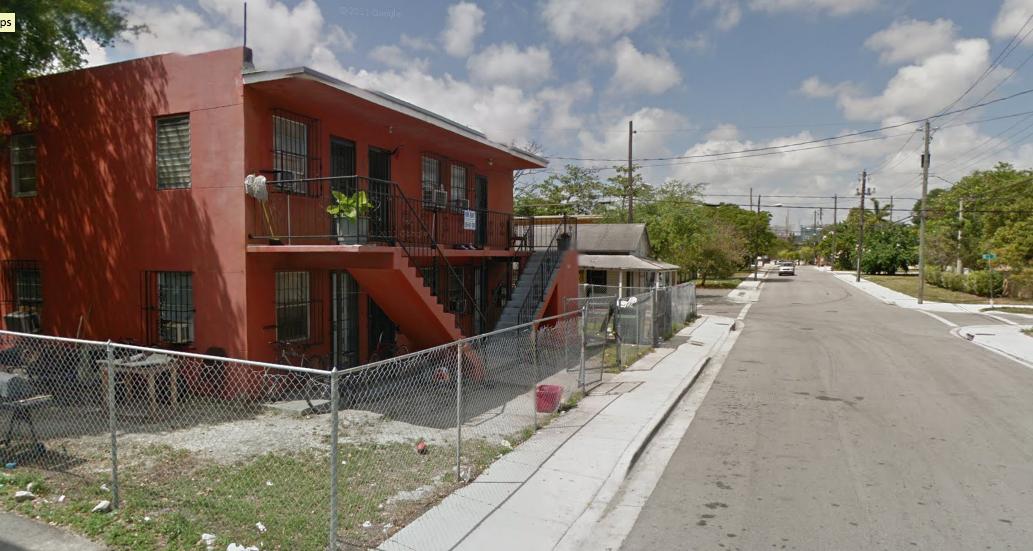
Percentage with at least a bachelors degree: 48.1%.
16. Rockford, Illinois.
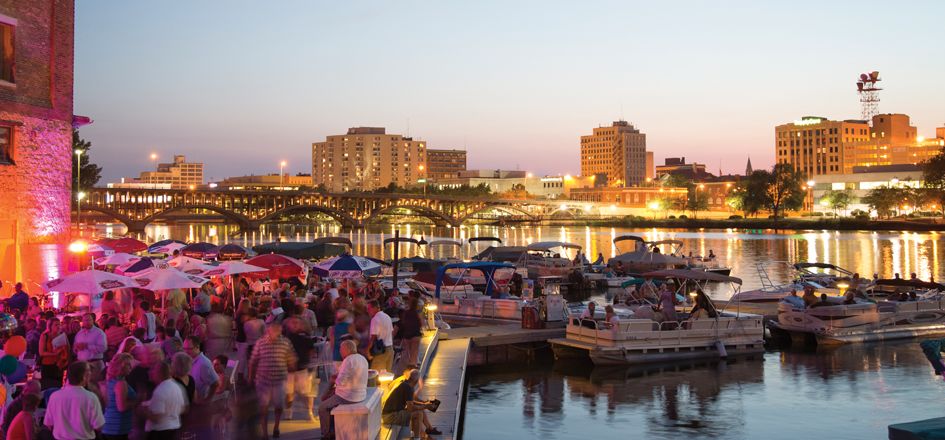
Population: 149,346, Average House Value: $87,200, Poverty Rate: 22.4%.
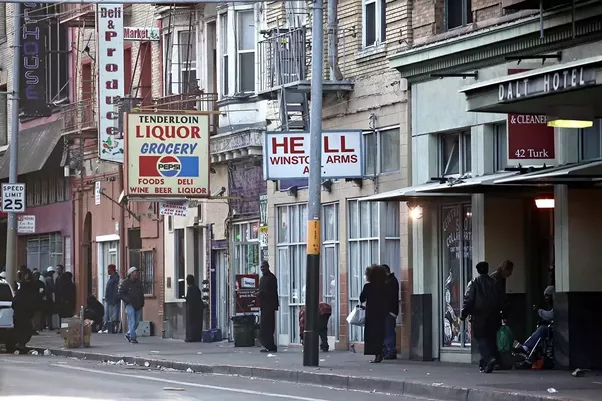
Percentage with at least a bachelors degree: 20.9%.
15. Jackson, Missisippi.
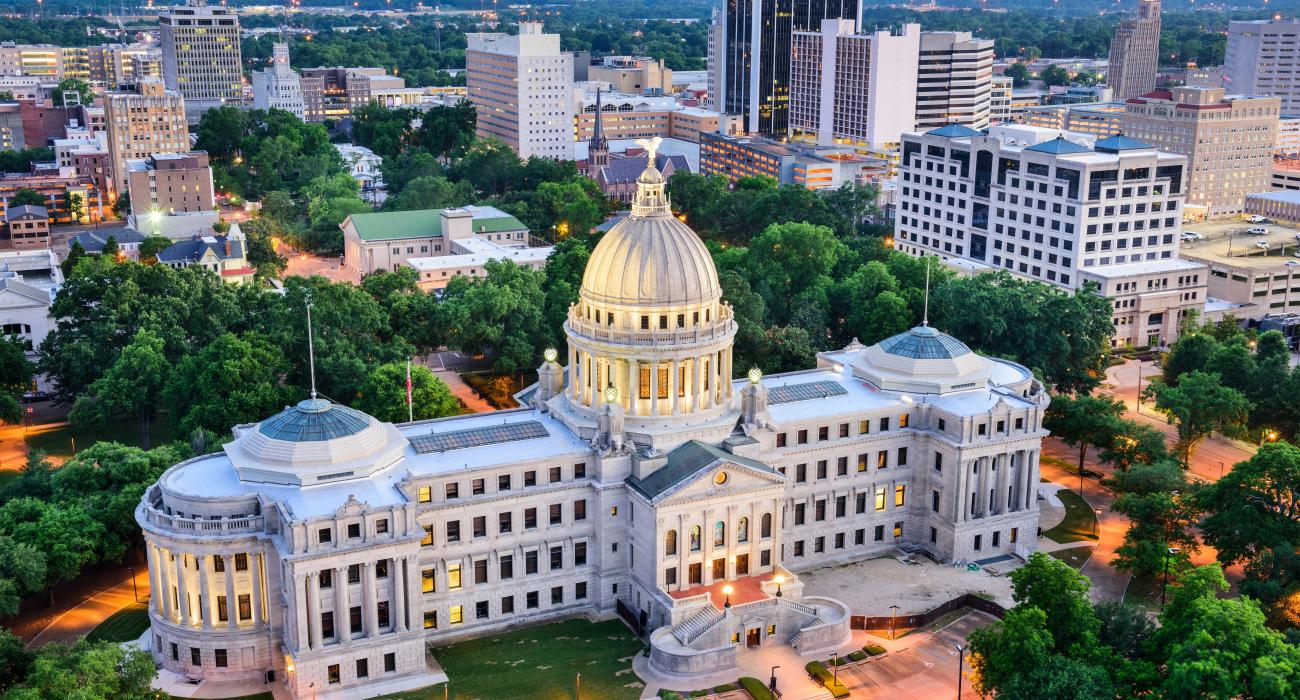
Population: 170,811, Average House Value: $92,600, Poverty Rate: 31.7%.
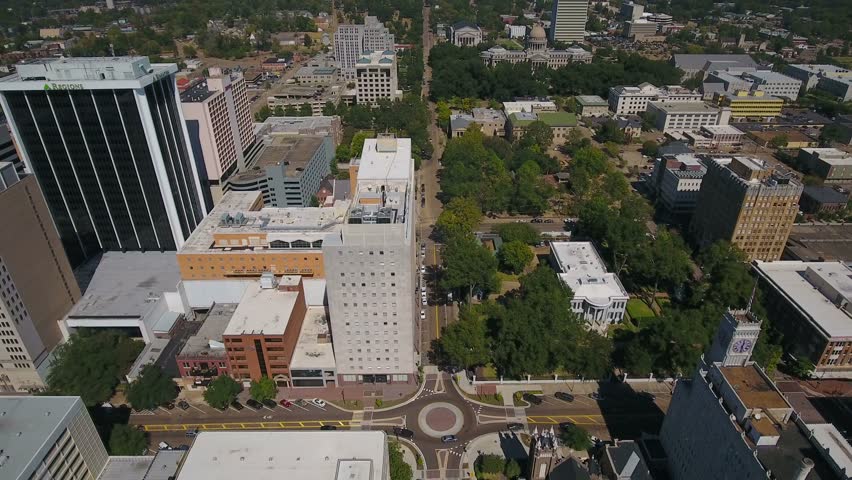
Percentage with at least a bachelors degree: 26.9%.
14. Baltimore, Maryland.
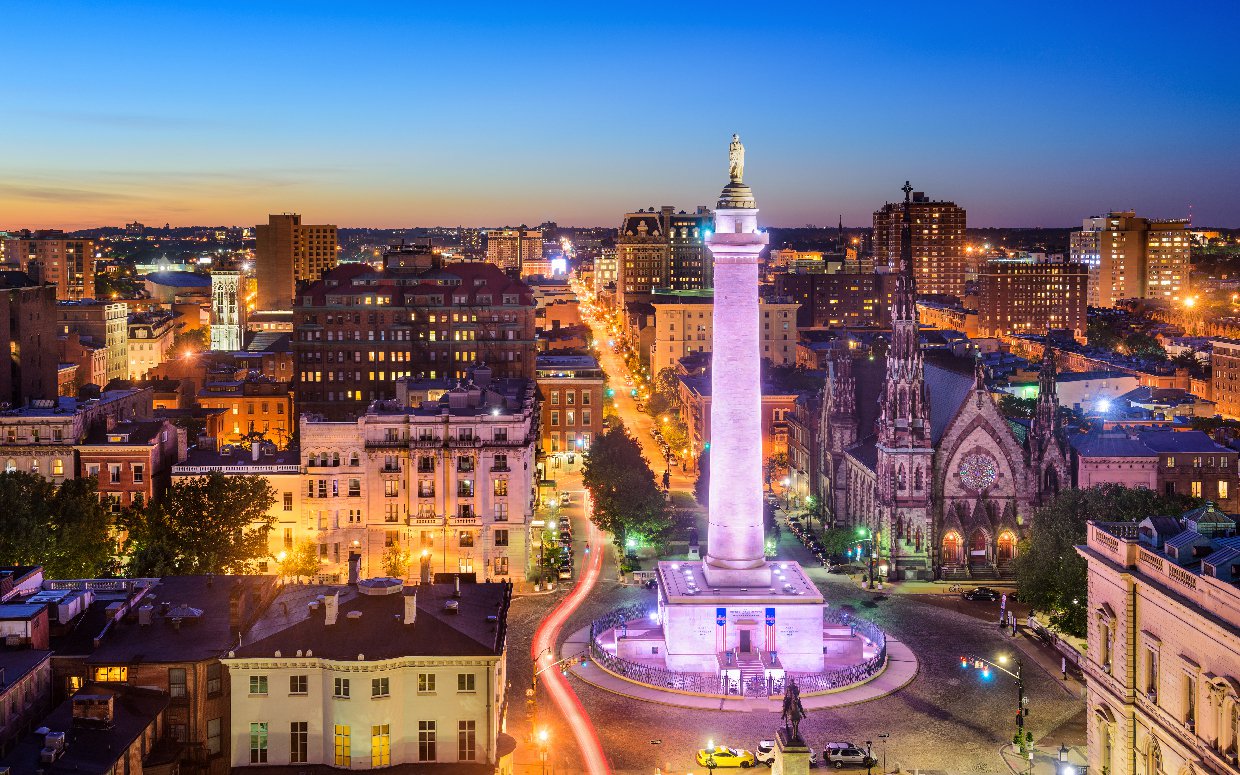
Population: 621,849, Average House Value: $155,600, Poverty Rate: 22.9%.
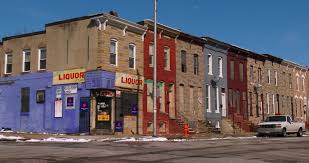
Percentage with at least a bachelors degree: 29.9%.
13. Stockton, California.
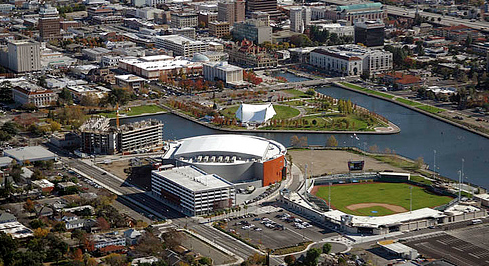
Population: 305,650, Average House Value: $224,300, Poverty Rate: 21.8%.
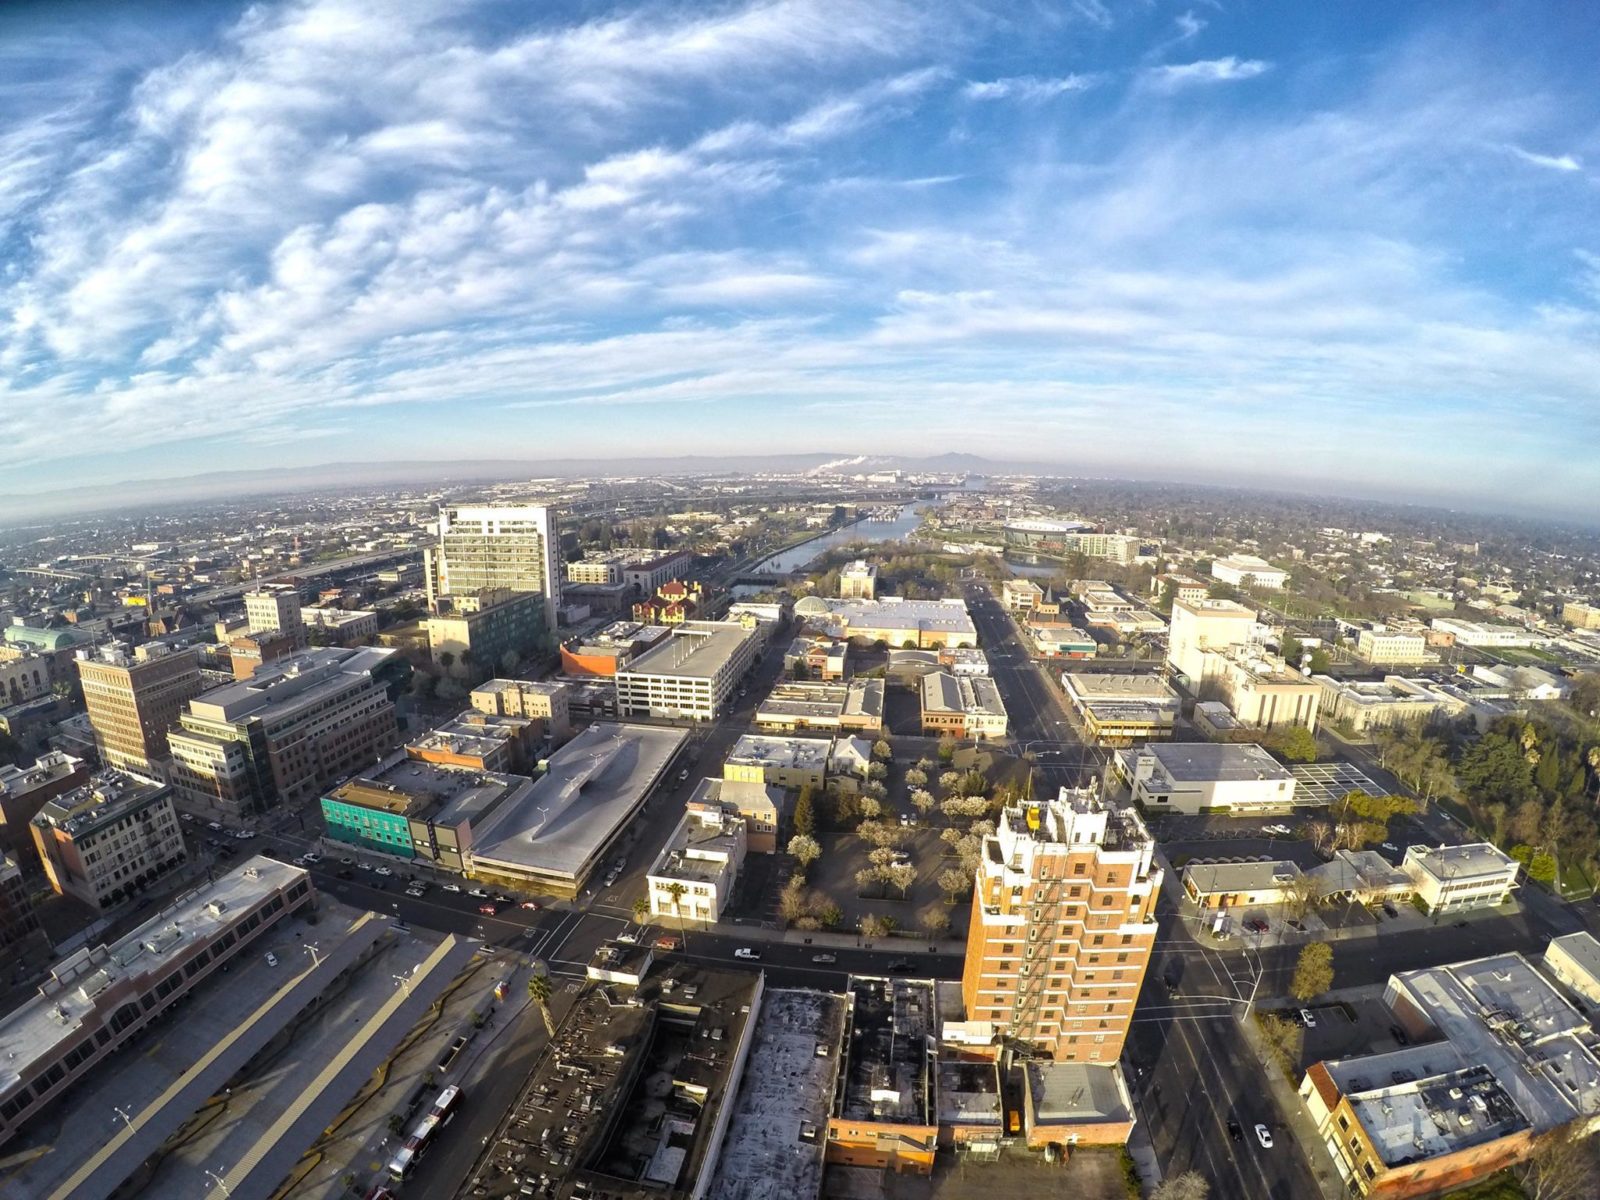
Percentage with at least a bachelors degree: 17.8%.
12. Springfield, Missouri.
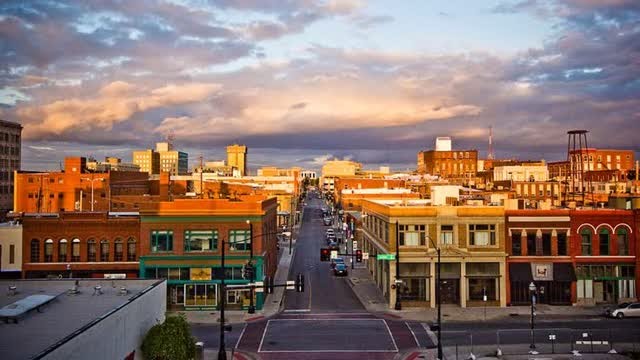
Population: 166,798, Average House Value: $113,500, Poverty Rate: 24.1%.
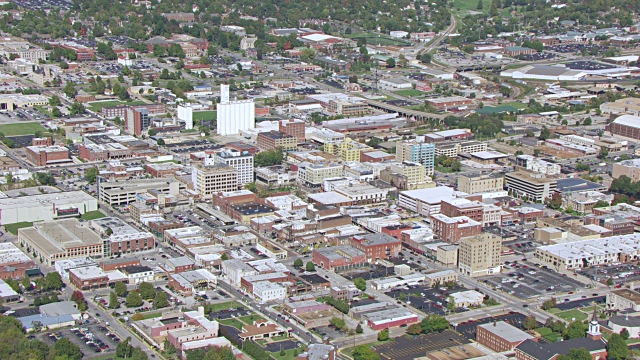
Percentage with at least a bachelors degree: 28%.
11. San Bernardino, California.
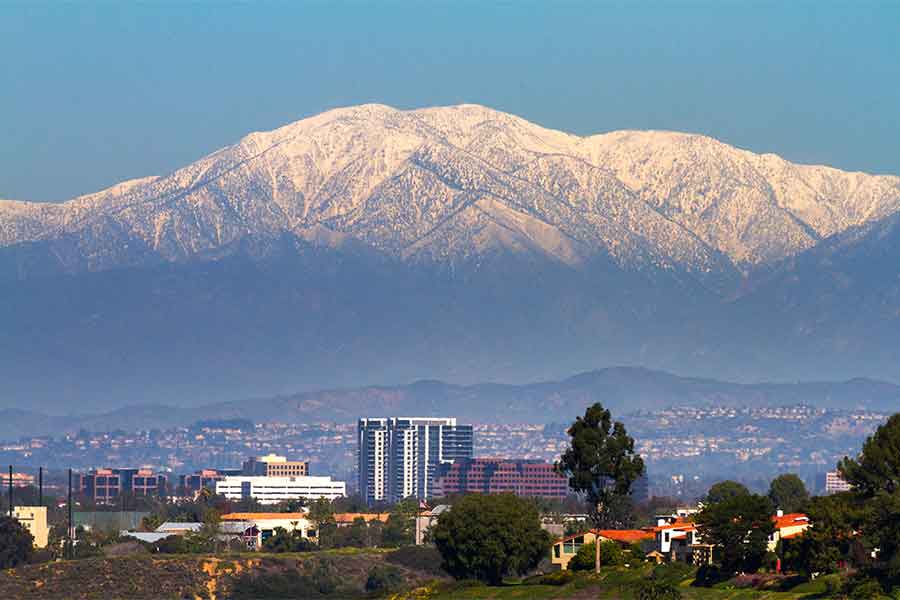
Population: 216,137, Average House Value: $201,300, Poverty Rate: 32.6%.
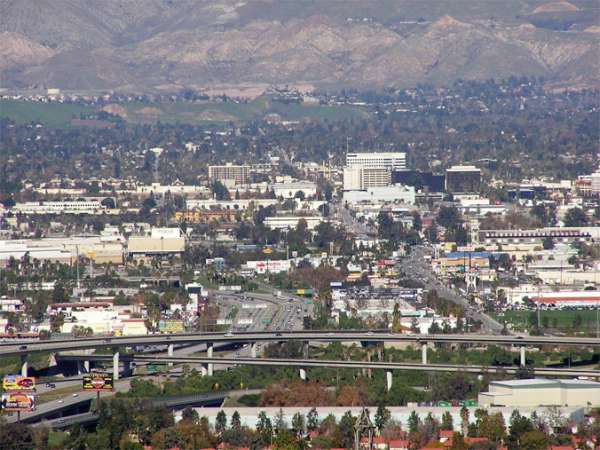
Percentage with at least a bachelors degree: 12.2%.
10. Wilmington, Delaware.
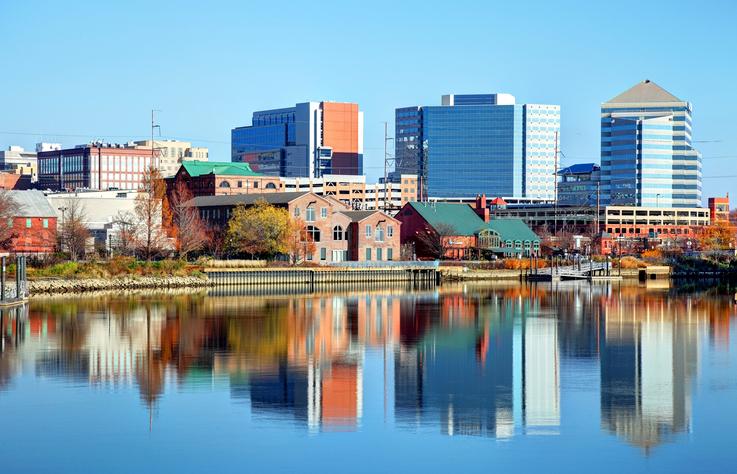
Population: 71,957, Average House Value: $160,300, Poverty Rate: 26%.
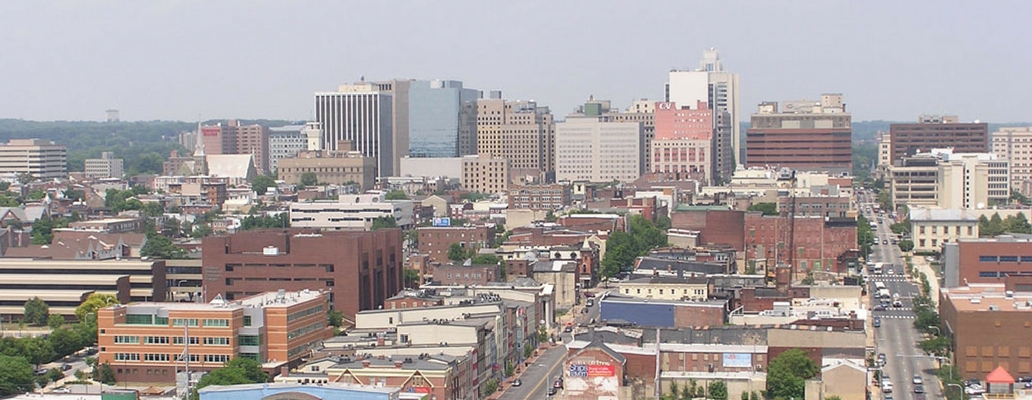
Percentage with at least a bachelors degree: 25.4%.
9. Merced, California.
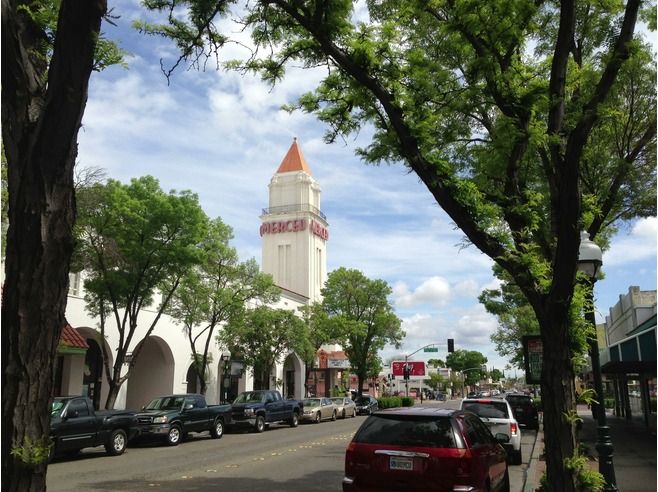
Population: 82,440, Average House Value: $204,400, Poverty Rate: 35.1%.
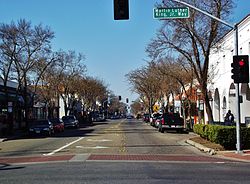
Percentage with at least a bachelors degree: 19.5%.
8. Hartford, Connecticut.

Population: 124,014, Average House Value: $159,200, Poverty Rate: 28.3%.
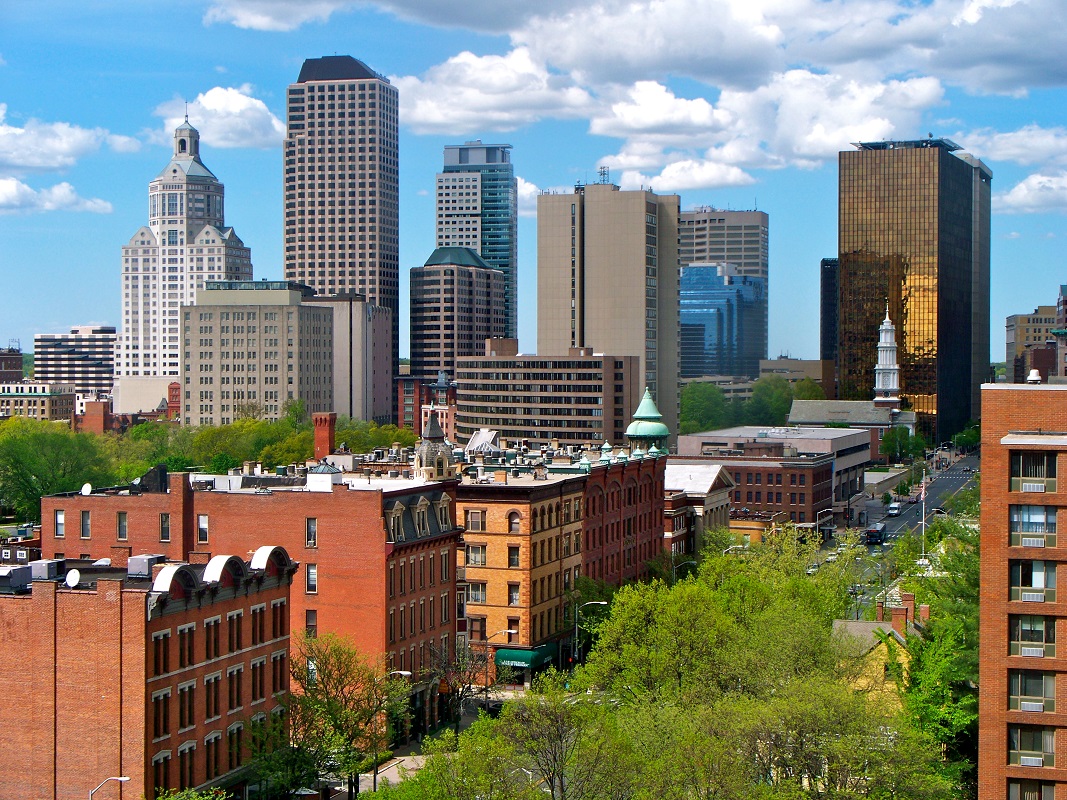
Percentage with at least a bachelors degree: 16.9%.
7. Albany, Georgia.
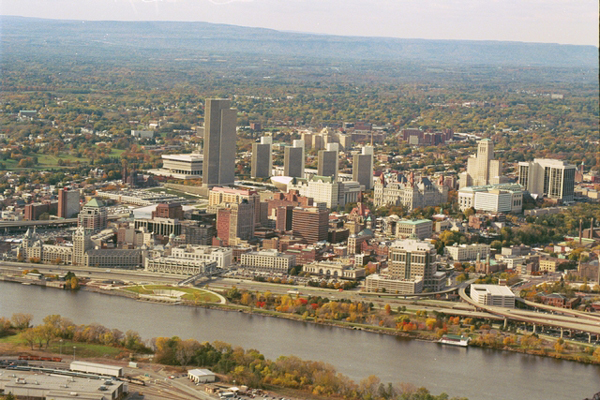
Population: 71,109, Average House Value: $92,600, Poverty Rate: 32%.
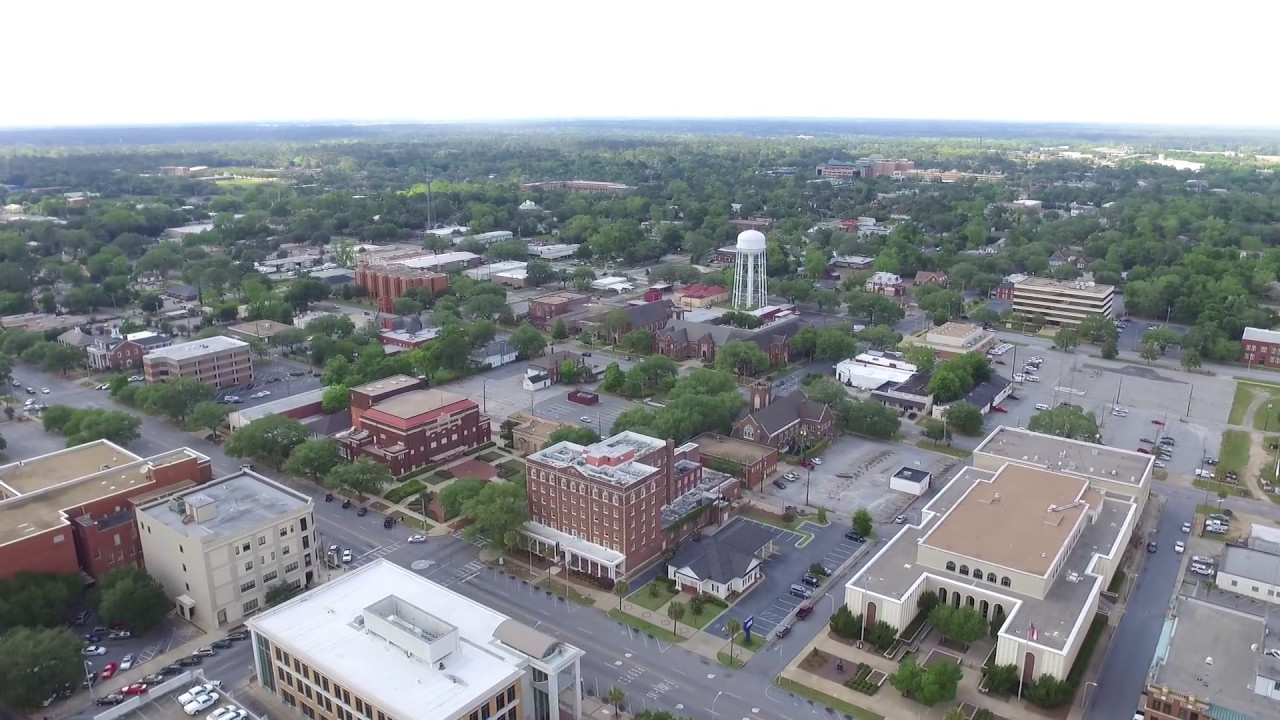
Percentage with at least a bachelors degree: 19%.
6. Milwaukee, Wisconsin.
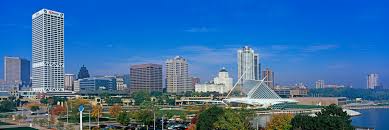
Population: 600,154, Average House Value: $114,000, Poverty Rate: 26.8%.
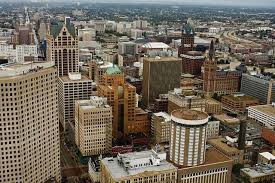
Percentage with at least a bachelors degree: 23.9%.
5. Memphis, Tennessee.
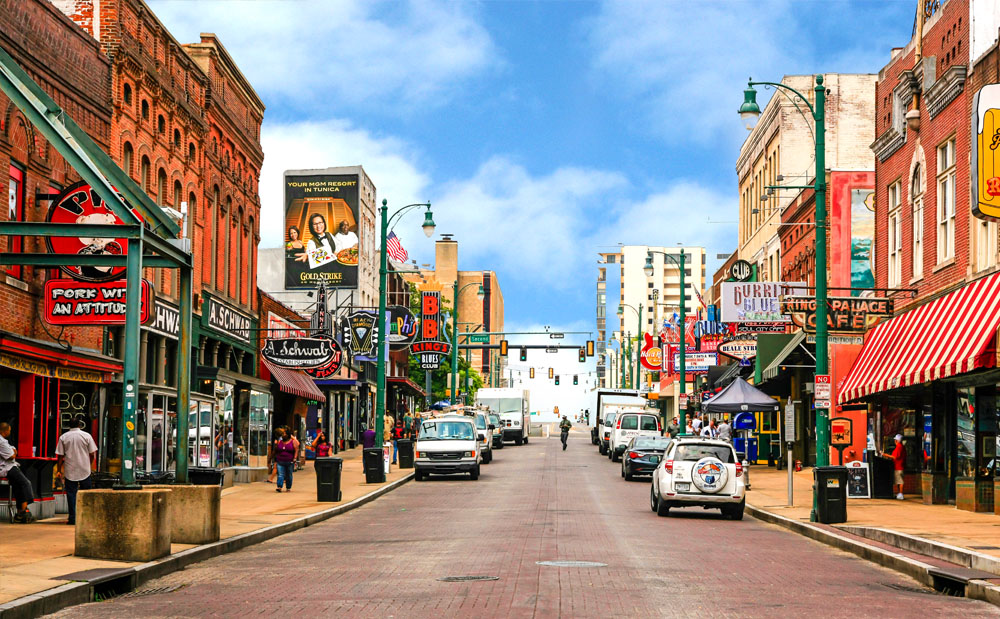
Population: 655,760, Average House Value: $94,400, Poverty Rate: 26.2%.
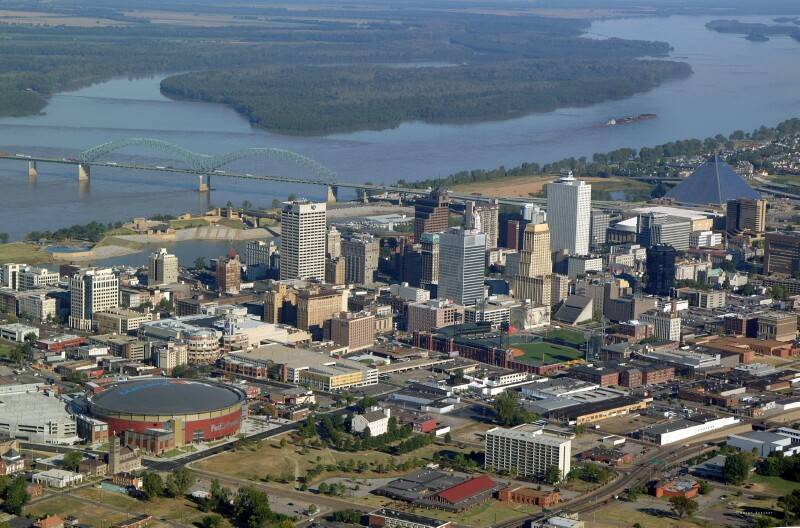
Percentage with at least a bachelors degree: 24.9%.
4. St Louis, Missouri.
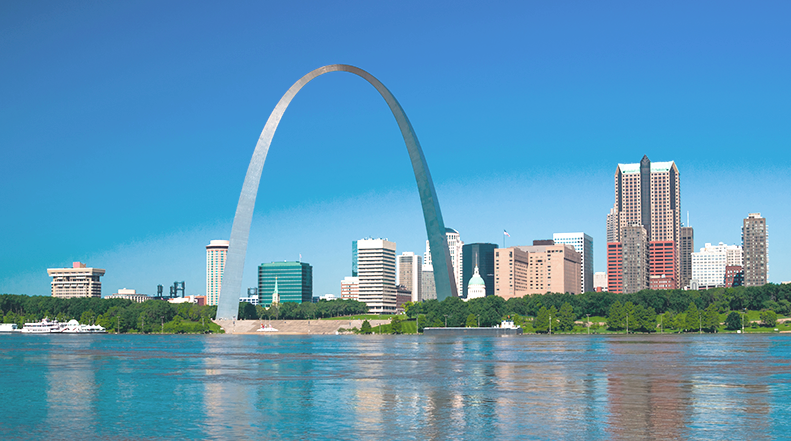
Population: 315,685, Average House Value: 130,800, Poverty Rate: 24.9%.
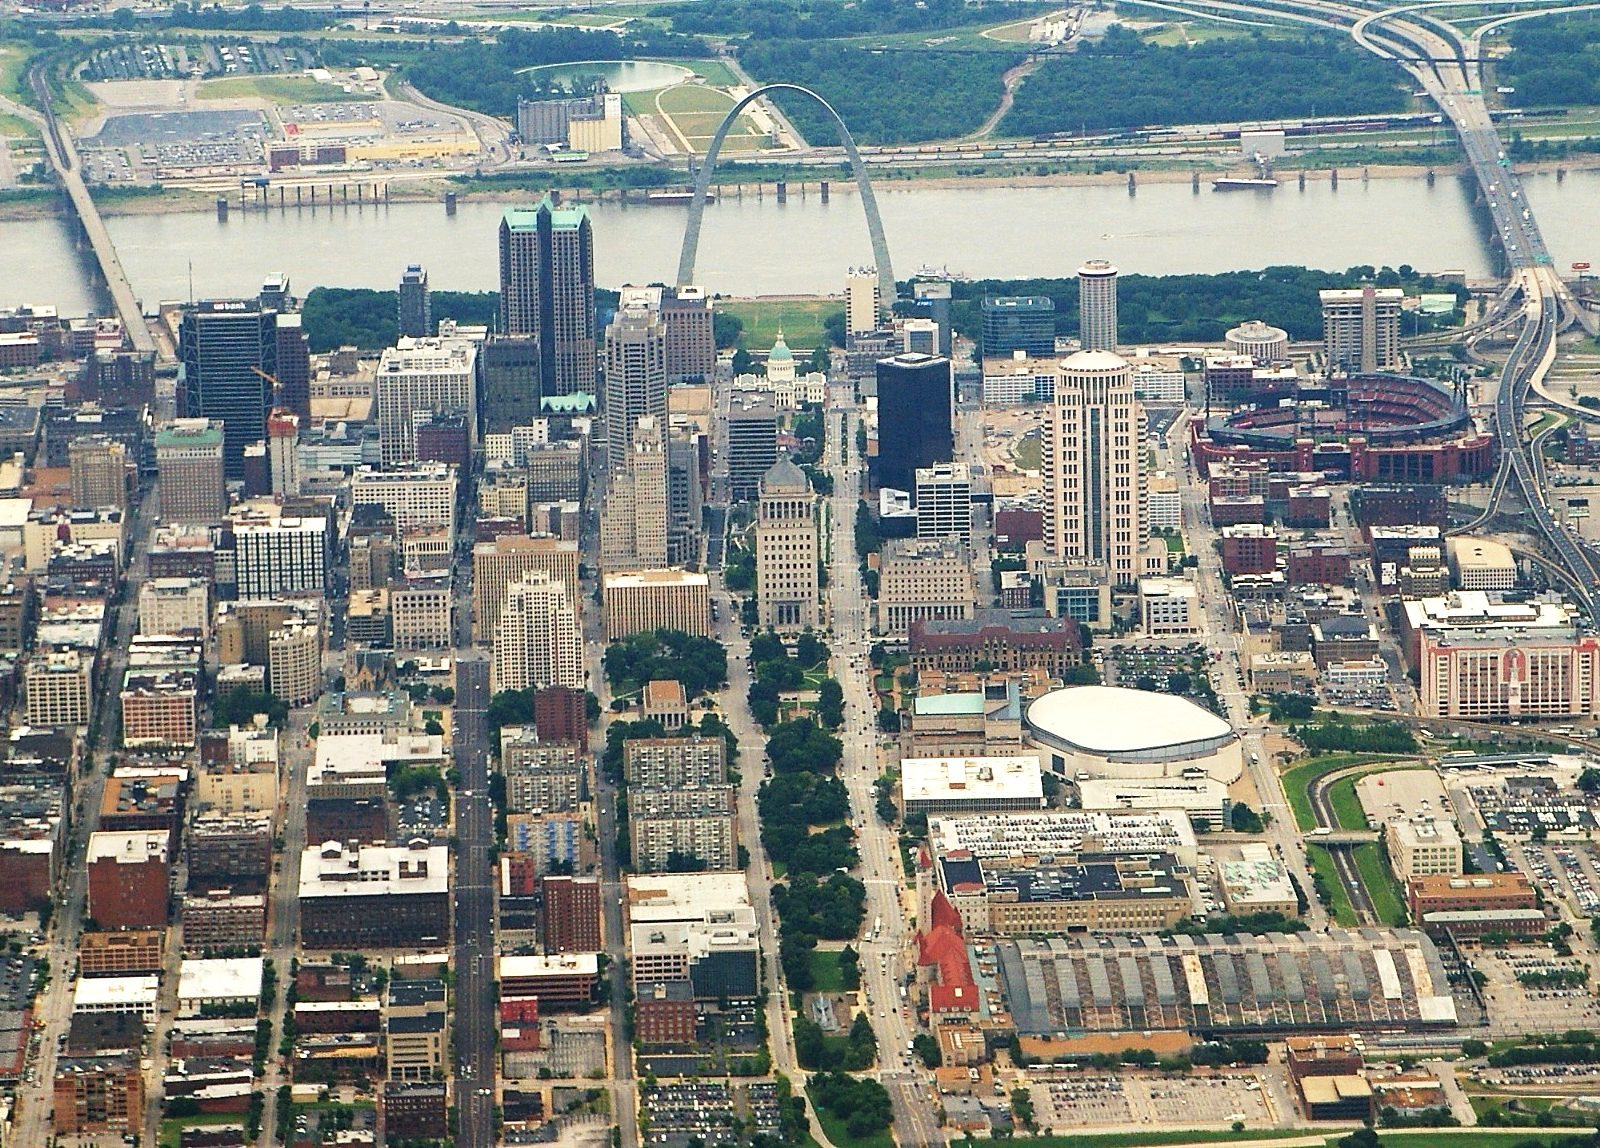
Percentage with at least a bachelors degree: 34.7%.
3. Flint, Michigan.
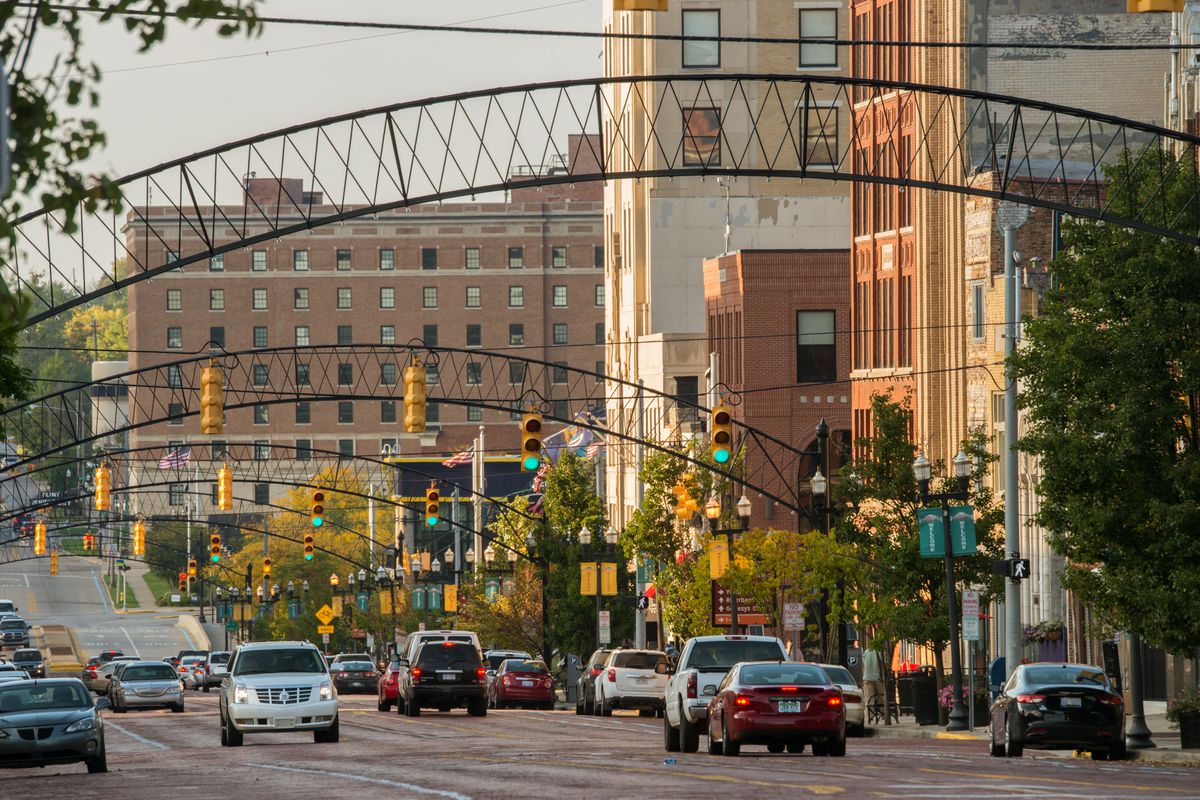
Population: 98,297, Average House Value: $25,900, Poverty Rate: 40.8%.
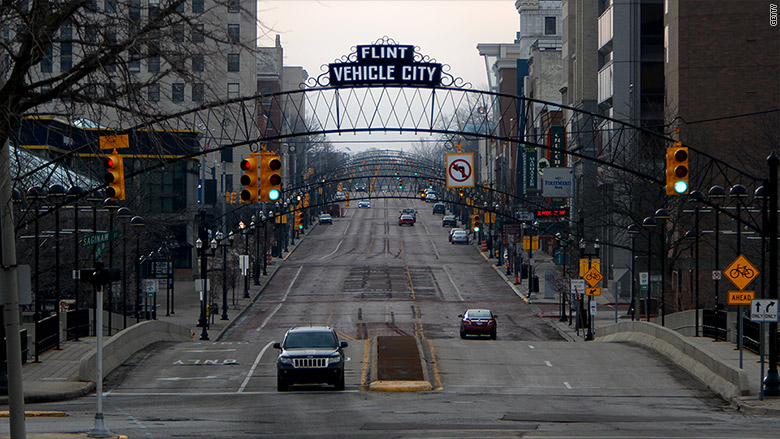
Percentage with at least a bachelors degree: 11.8%.
2. Birmingham, Alabama.
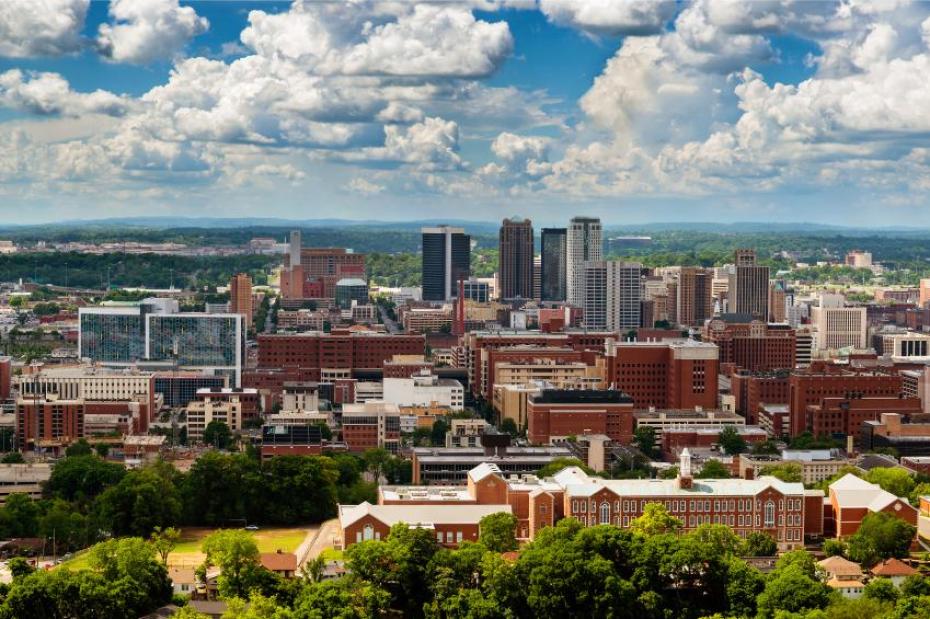
Population: 214,911, Average House Value: $93,000, Poverty Rate: 29.2%.
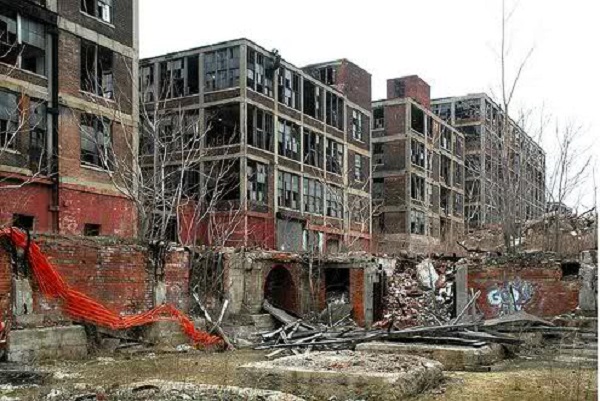
Percentage with at least a bachelors degree: 25.3%.
1. Detroit, Michigan.

Population: 677,124, Average House Value: $42,600, Poverty Rate: 39.8%, Percentage with at least a bachelors degree: 14.2%.
If you like this article please feel free to share it with your friends and family and don’t forget to let us know what you think in the comments.
